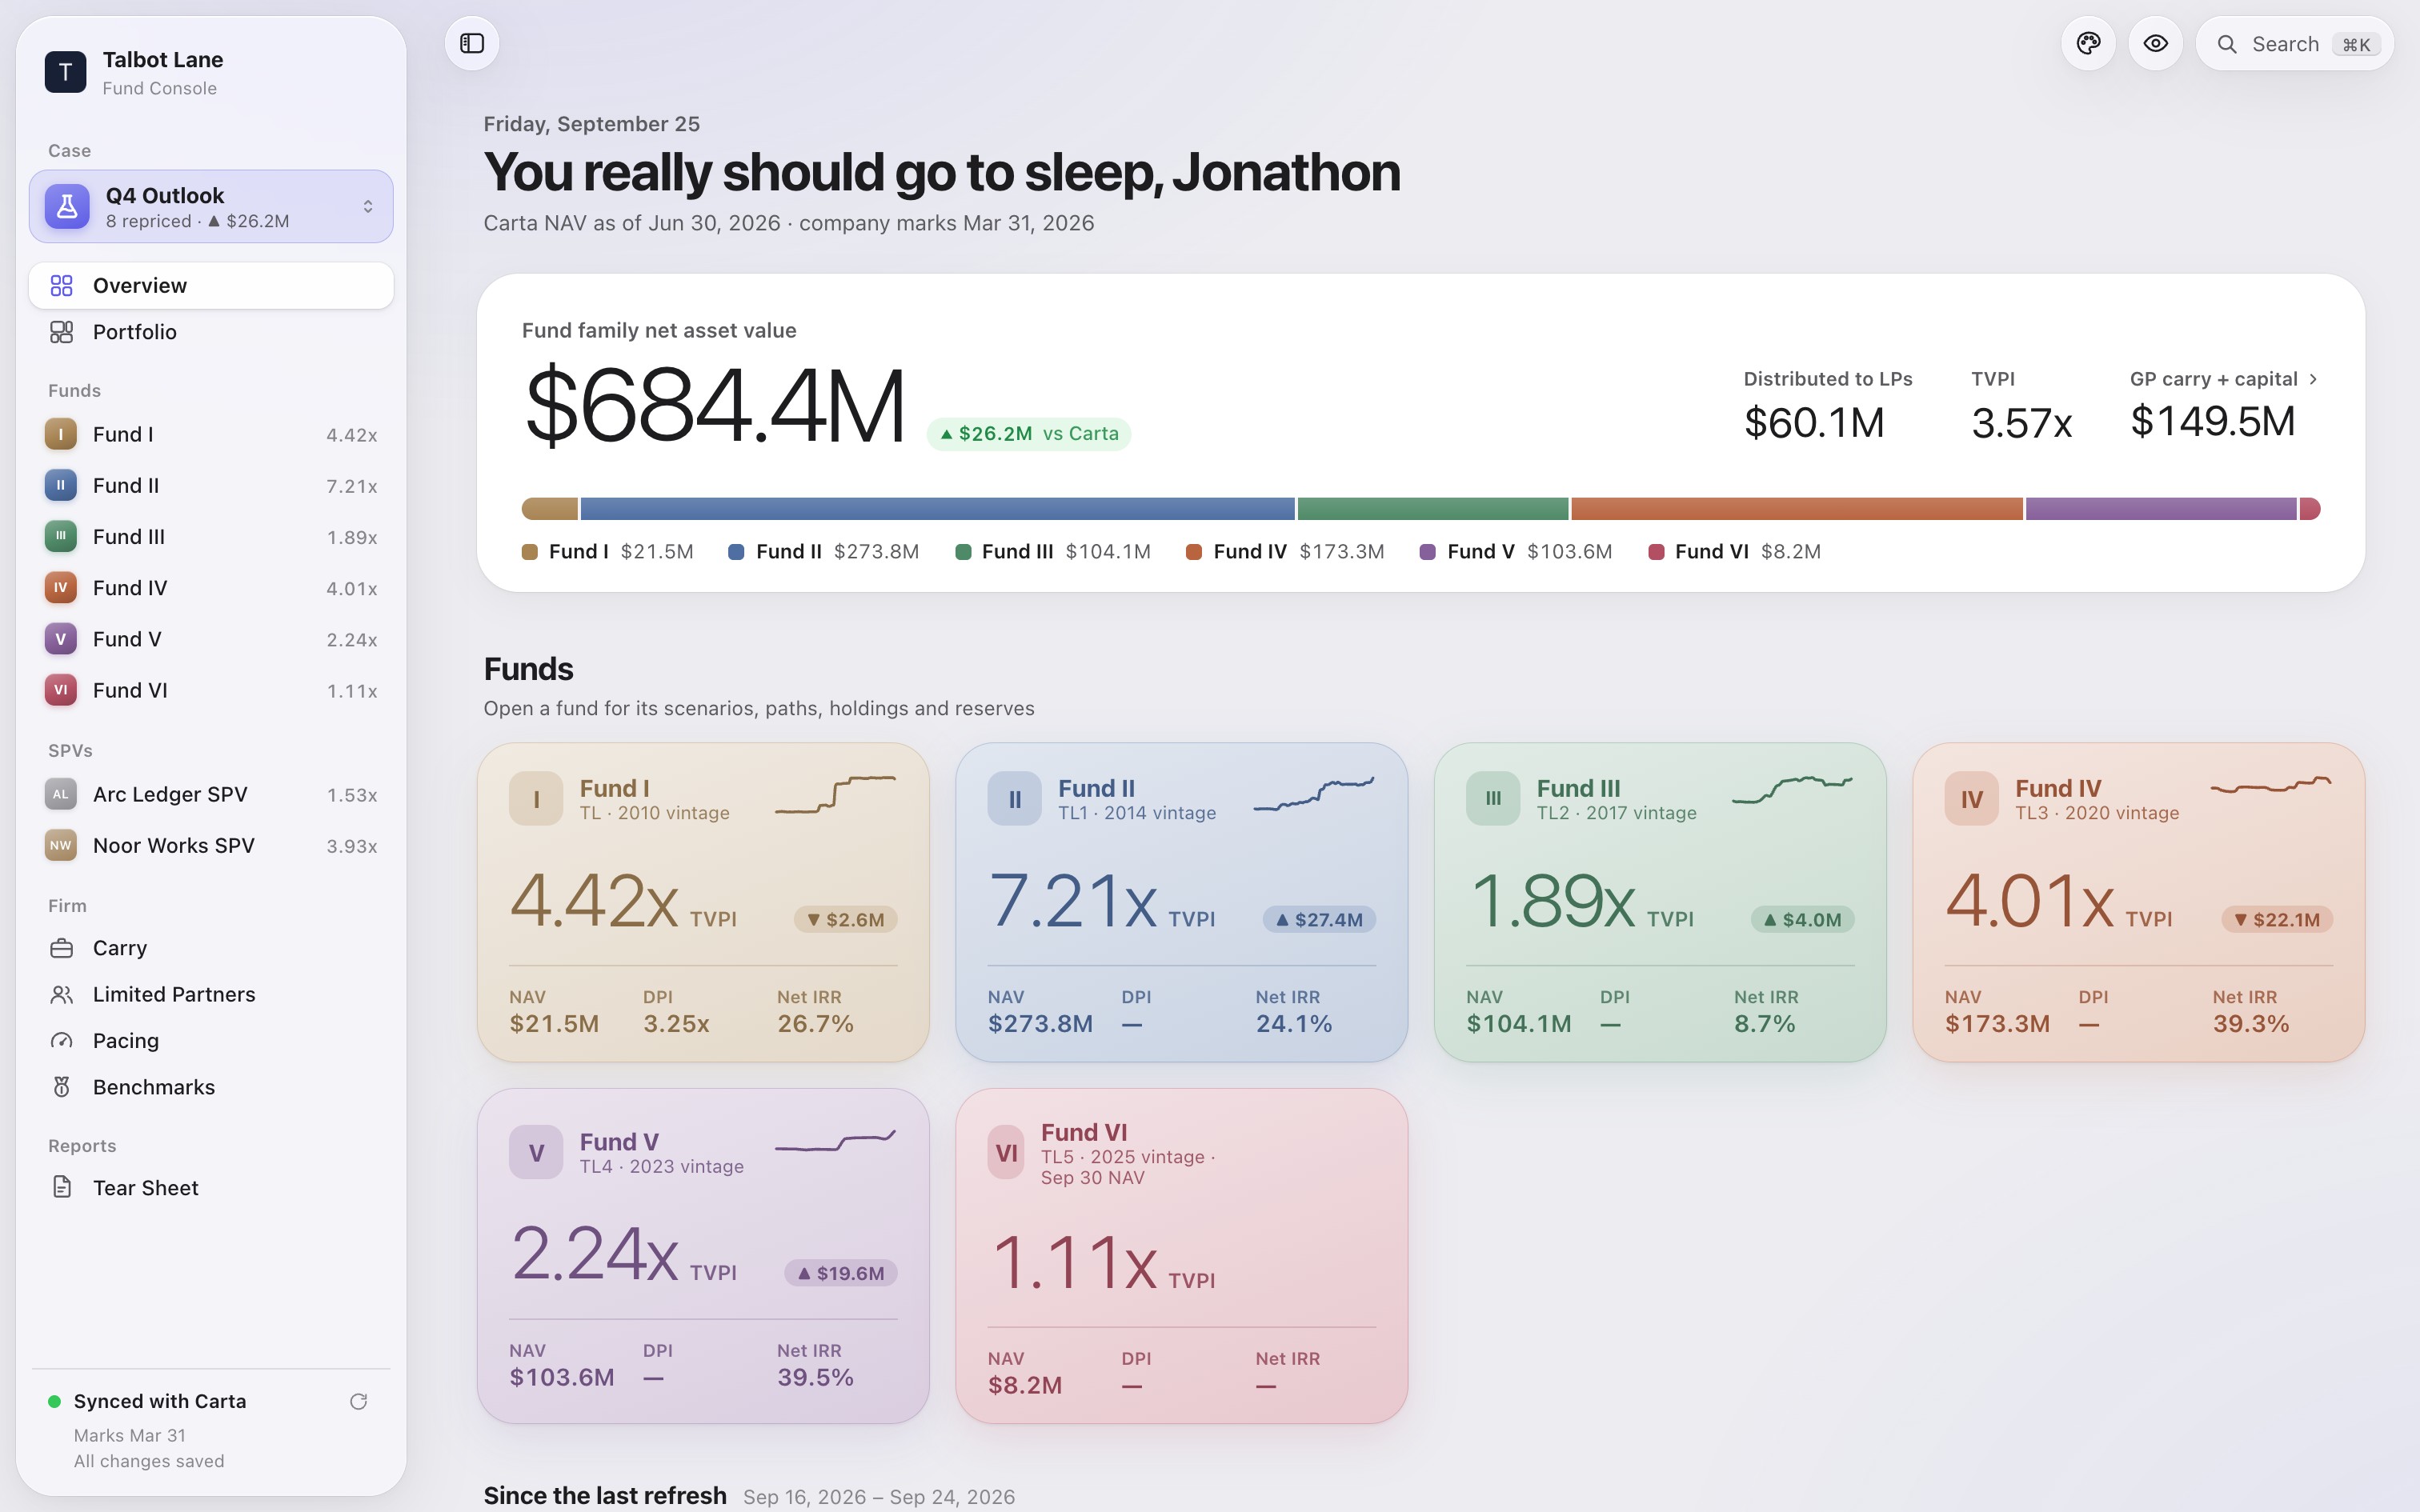
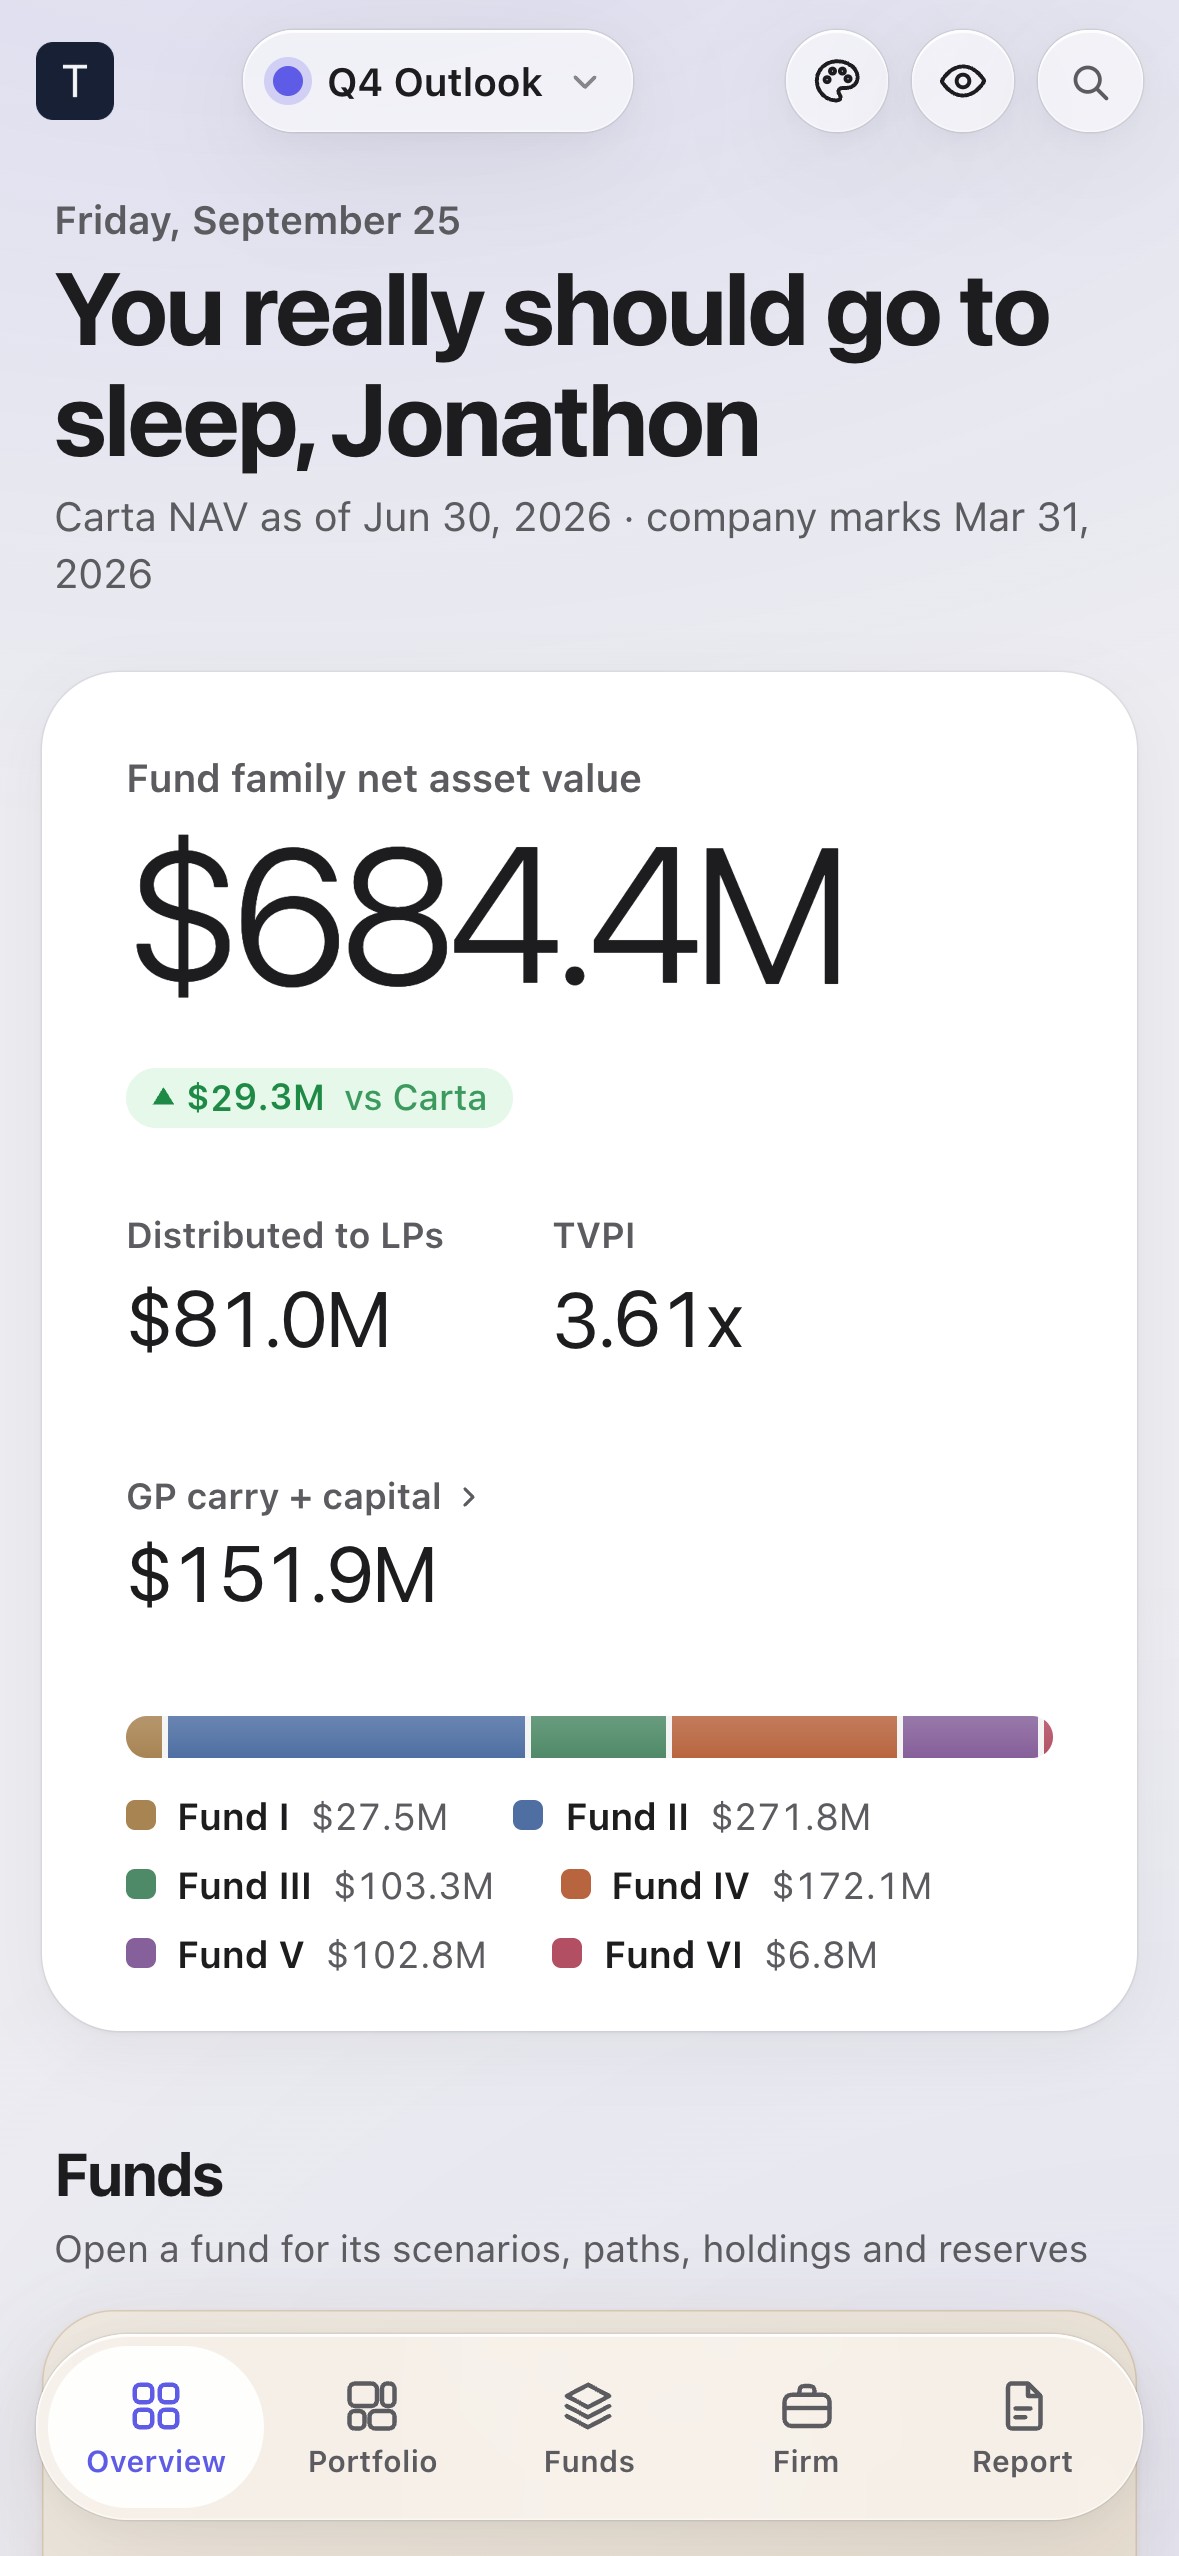
Your whole portfolio, synced with your admin data and rebuilt as a Mac app. Reprice any company, model any round, and watch NAV, TVPI, carry and every LP’s position roll to their new values.

Sample data. Fictional firm, funds, and figures.
Designed from first principles as a Mac app, not a web dashboard. The portfolio is the interface. Glass for navigation, calm surfaces for reading, and motion that follows physics.
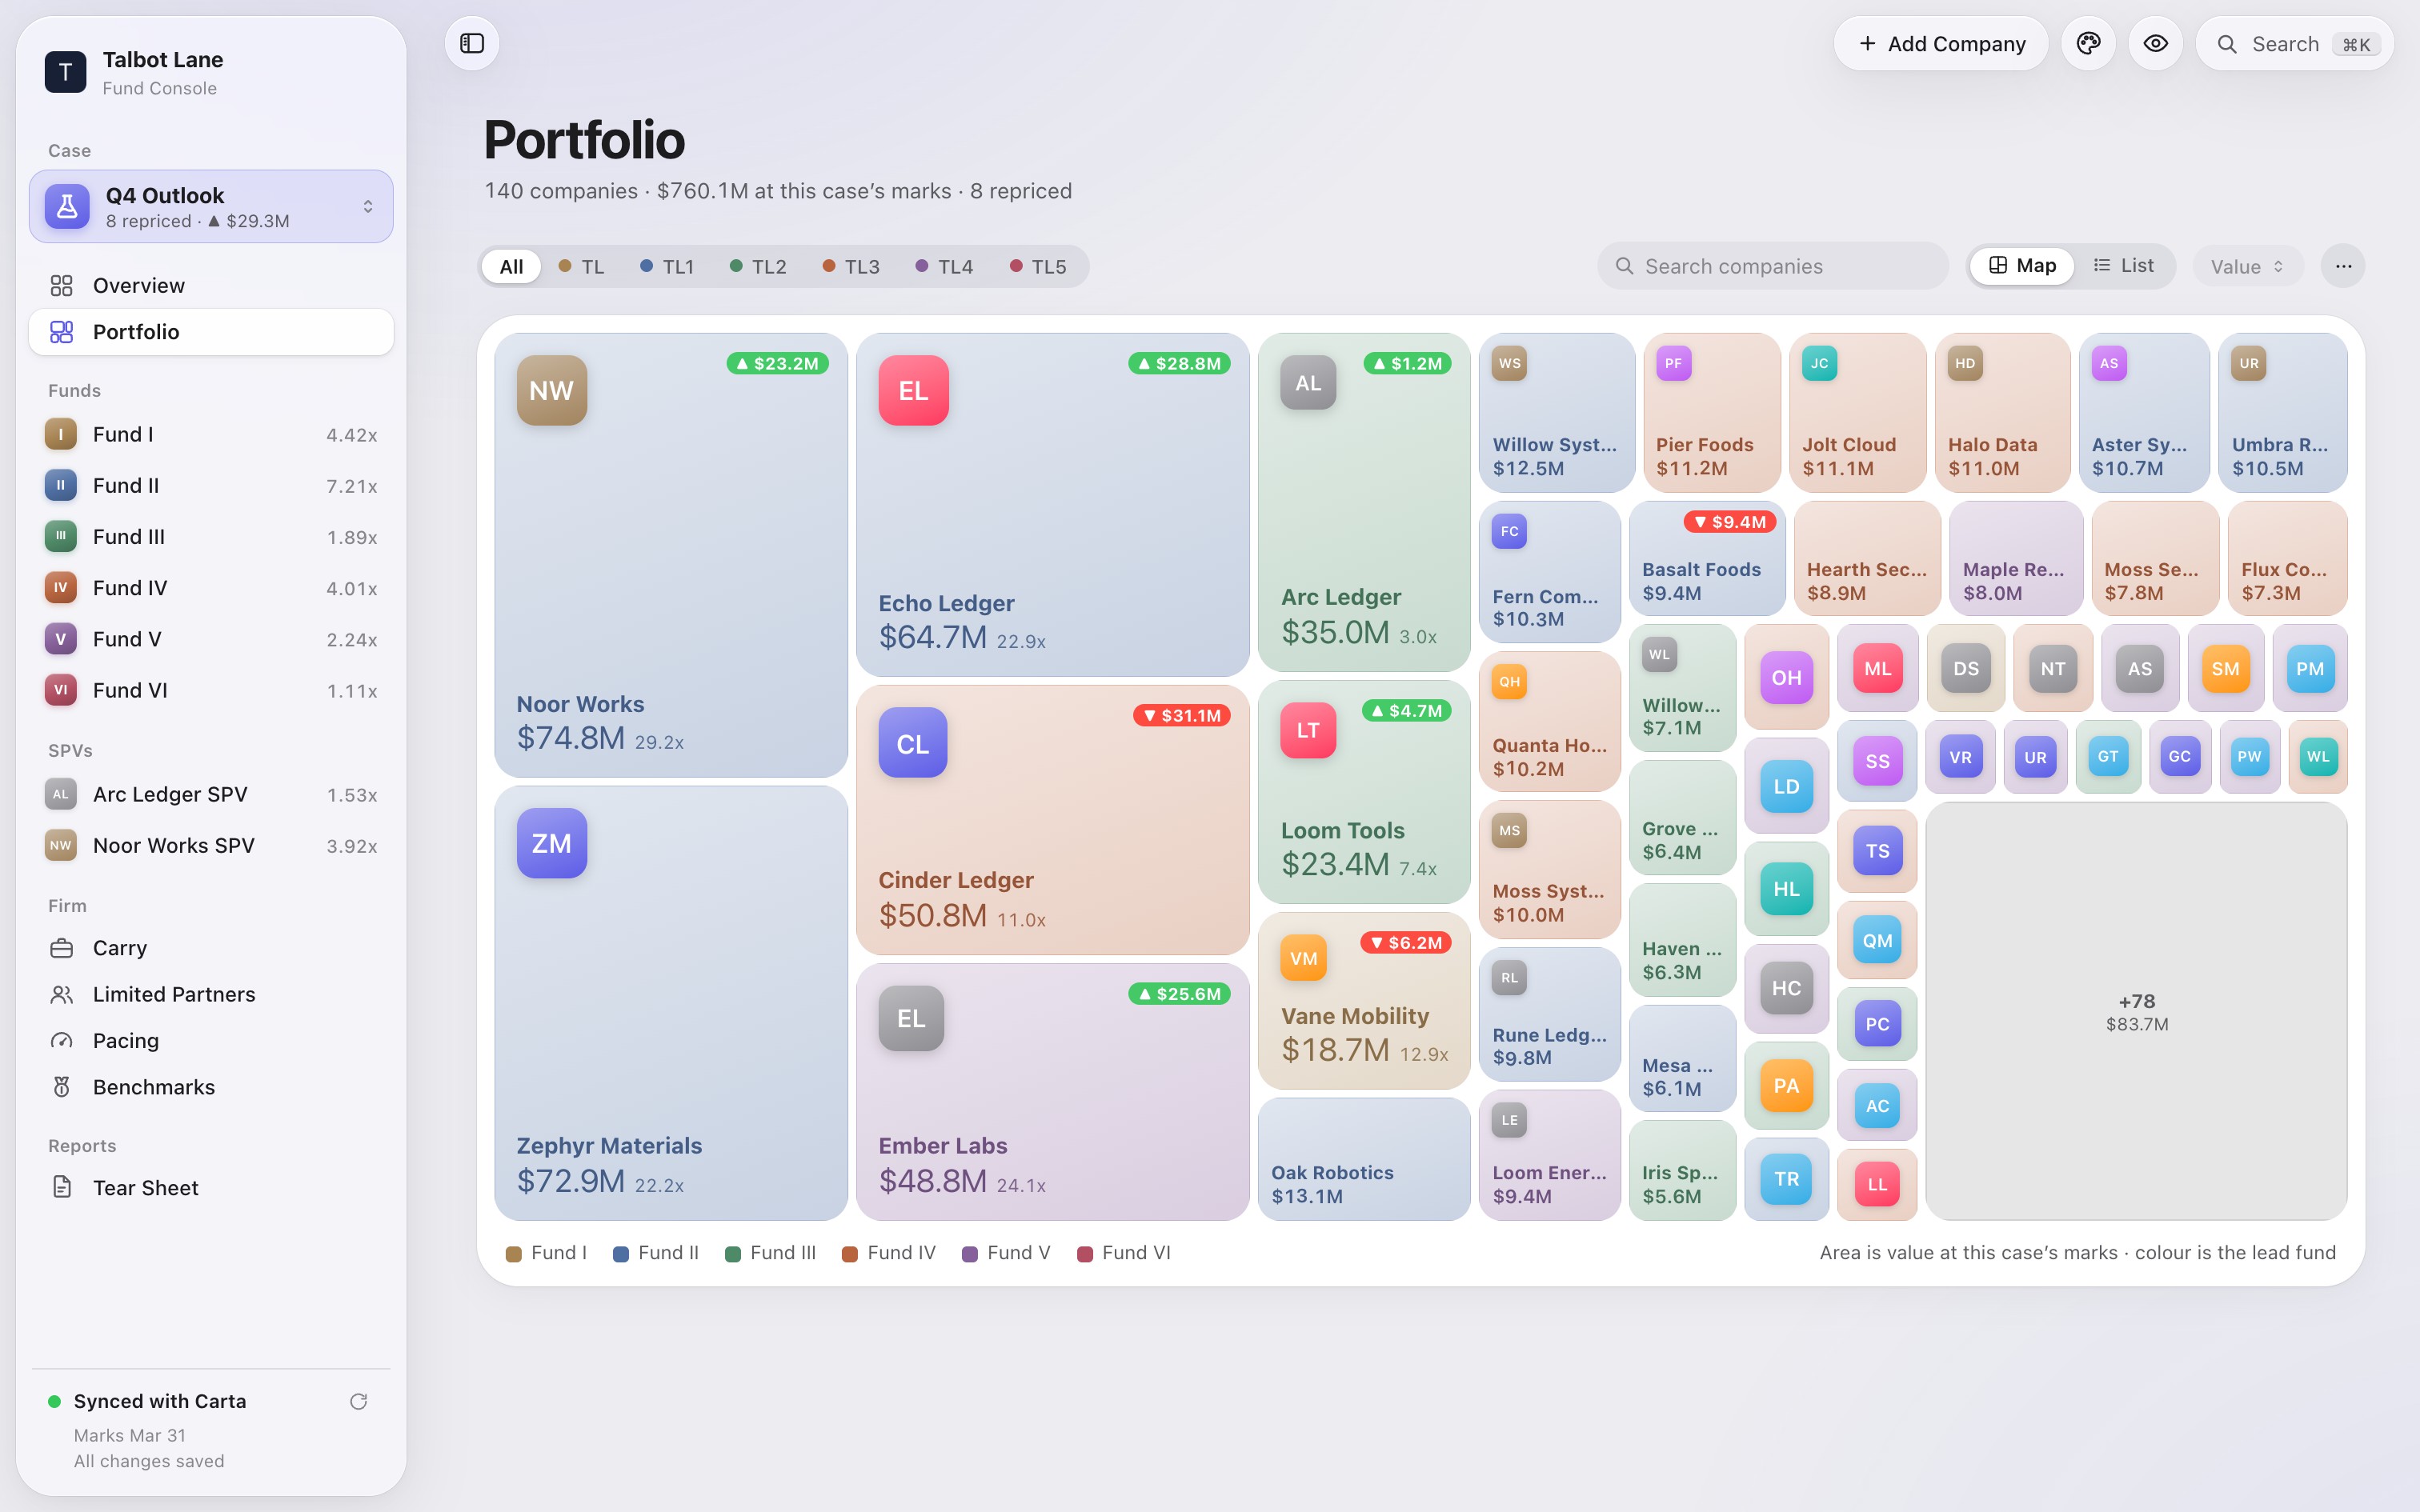
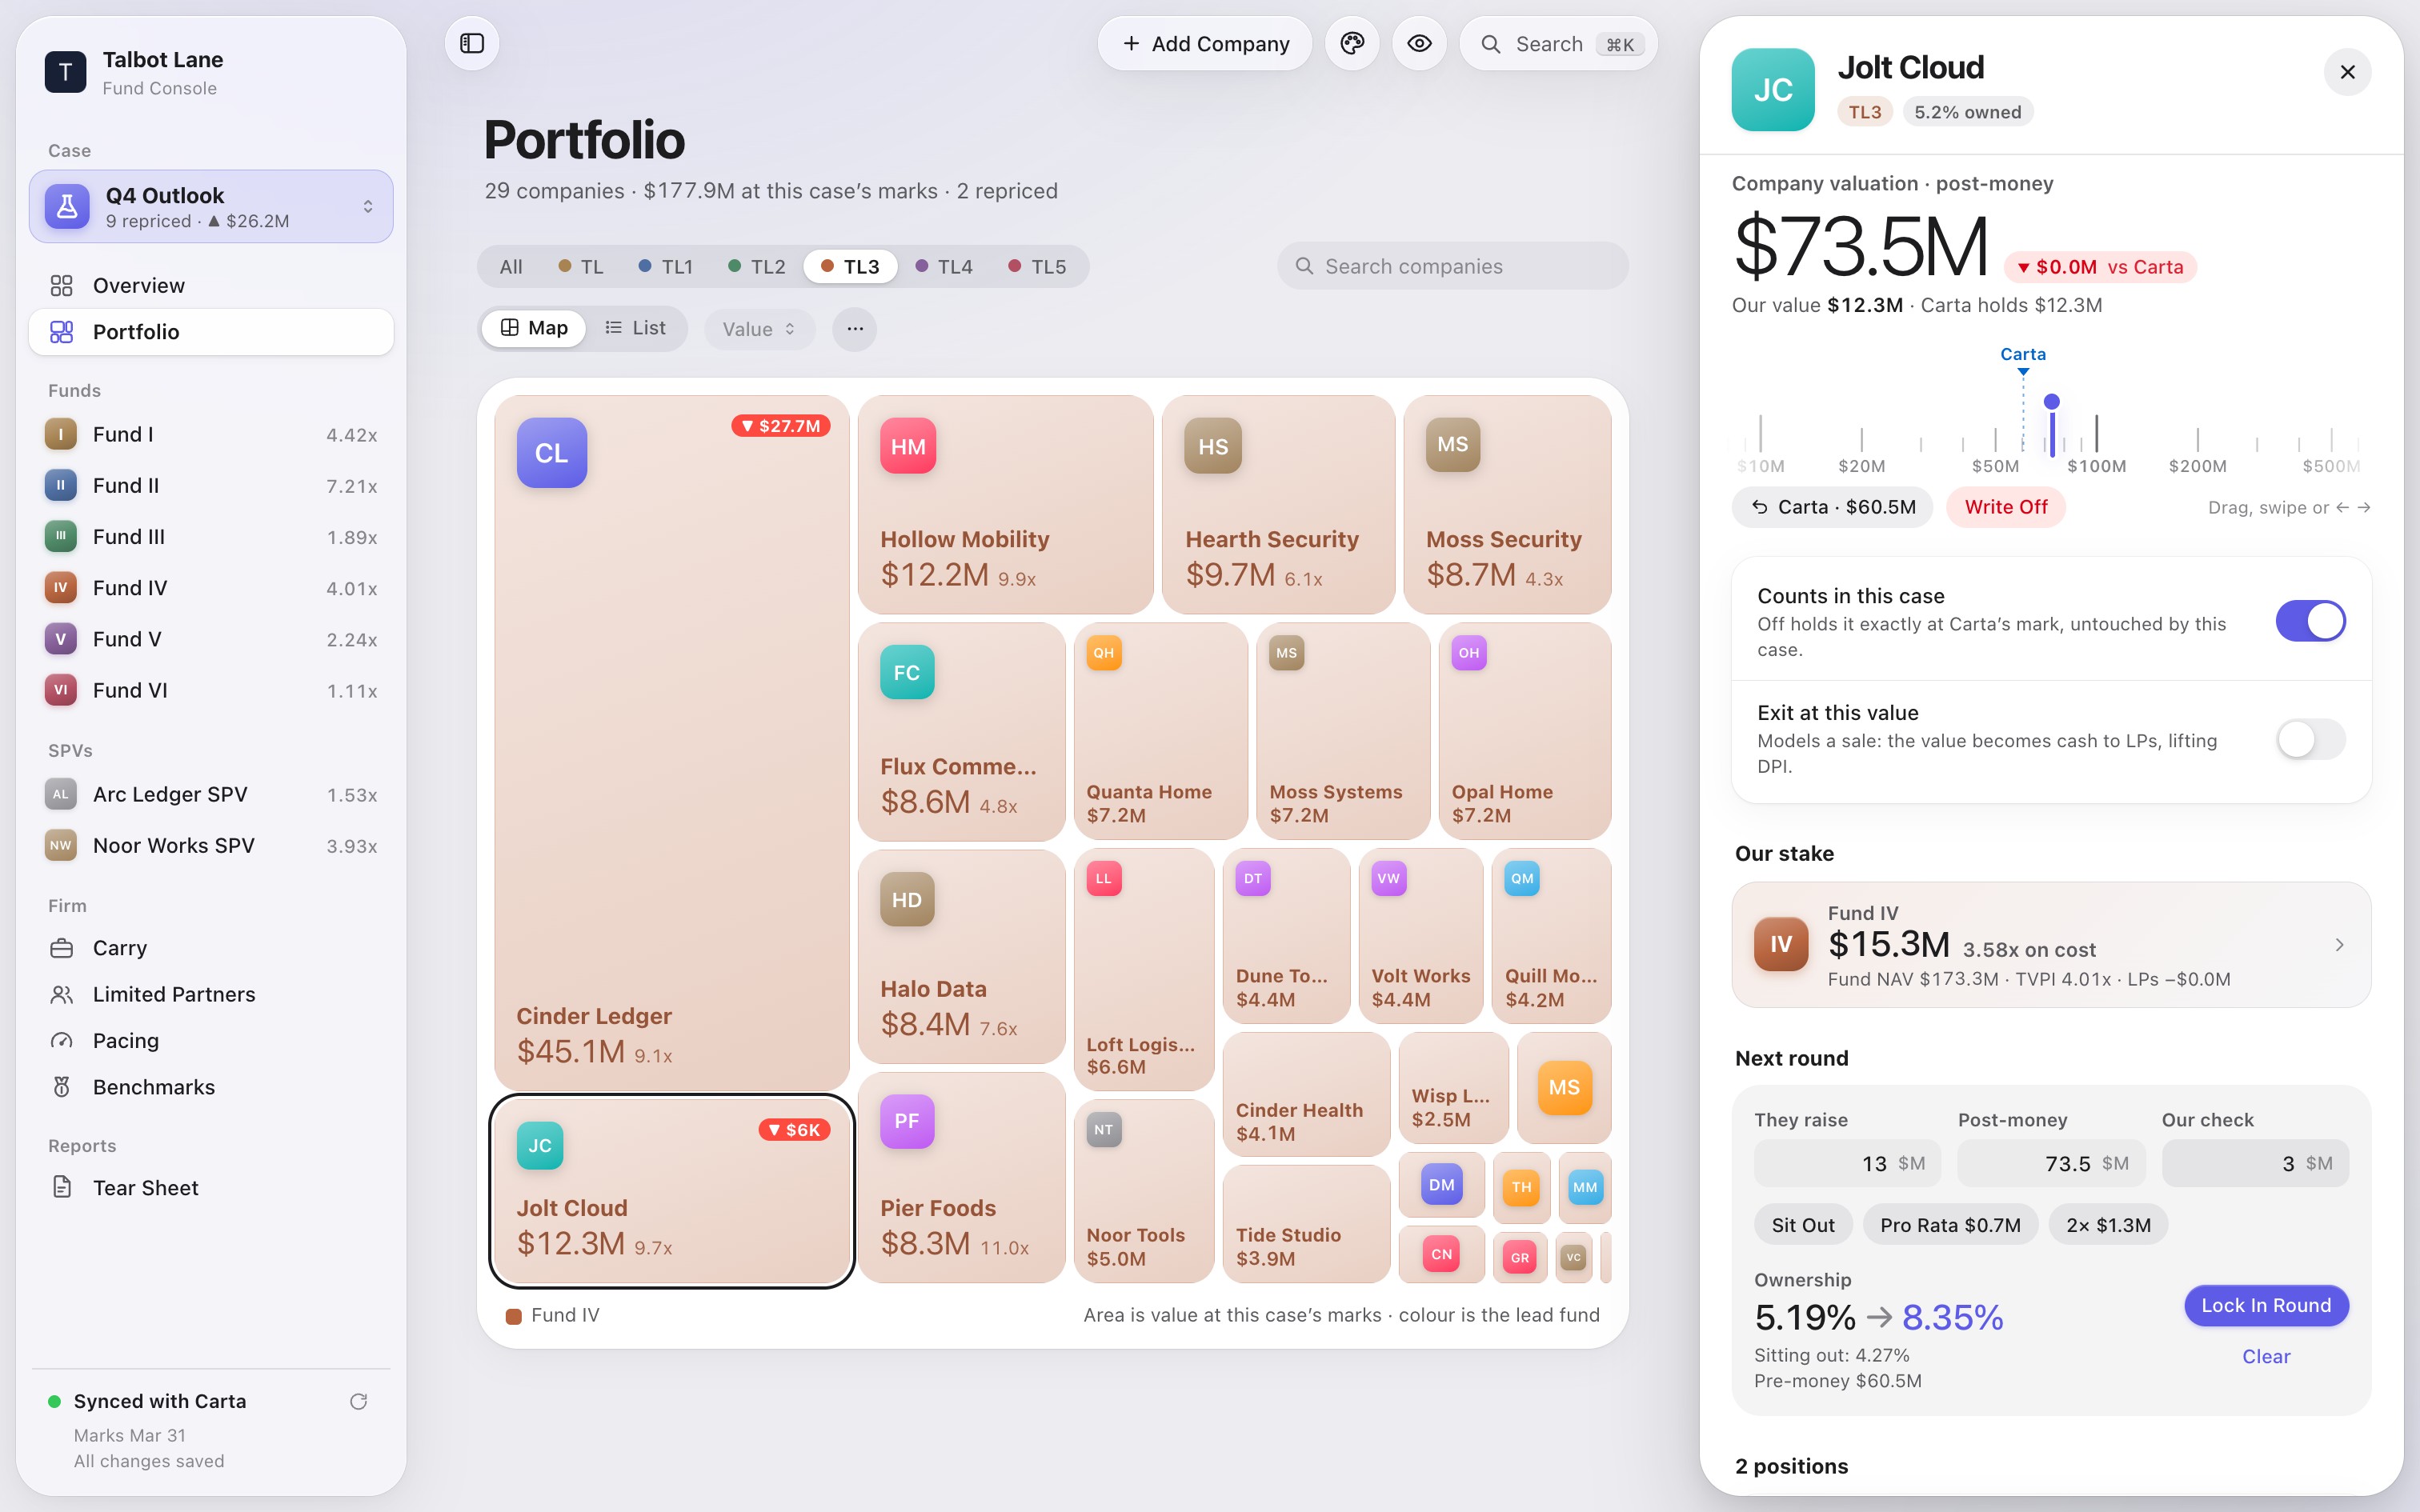
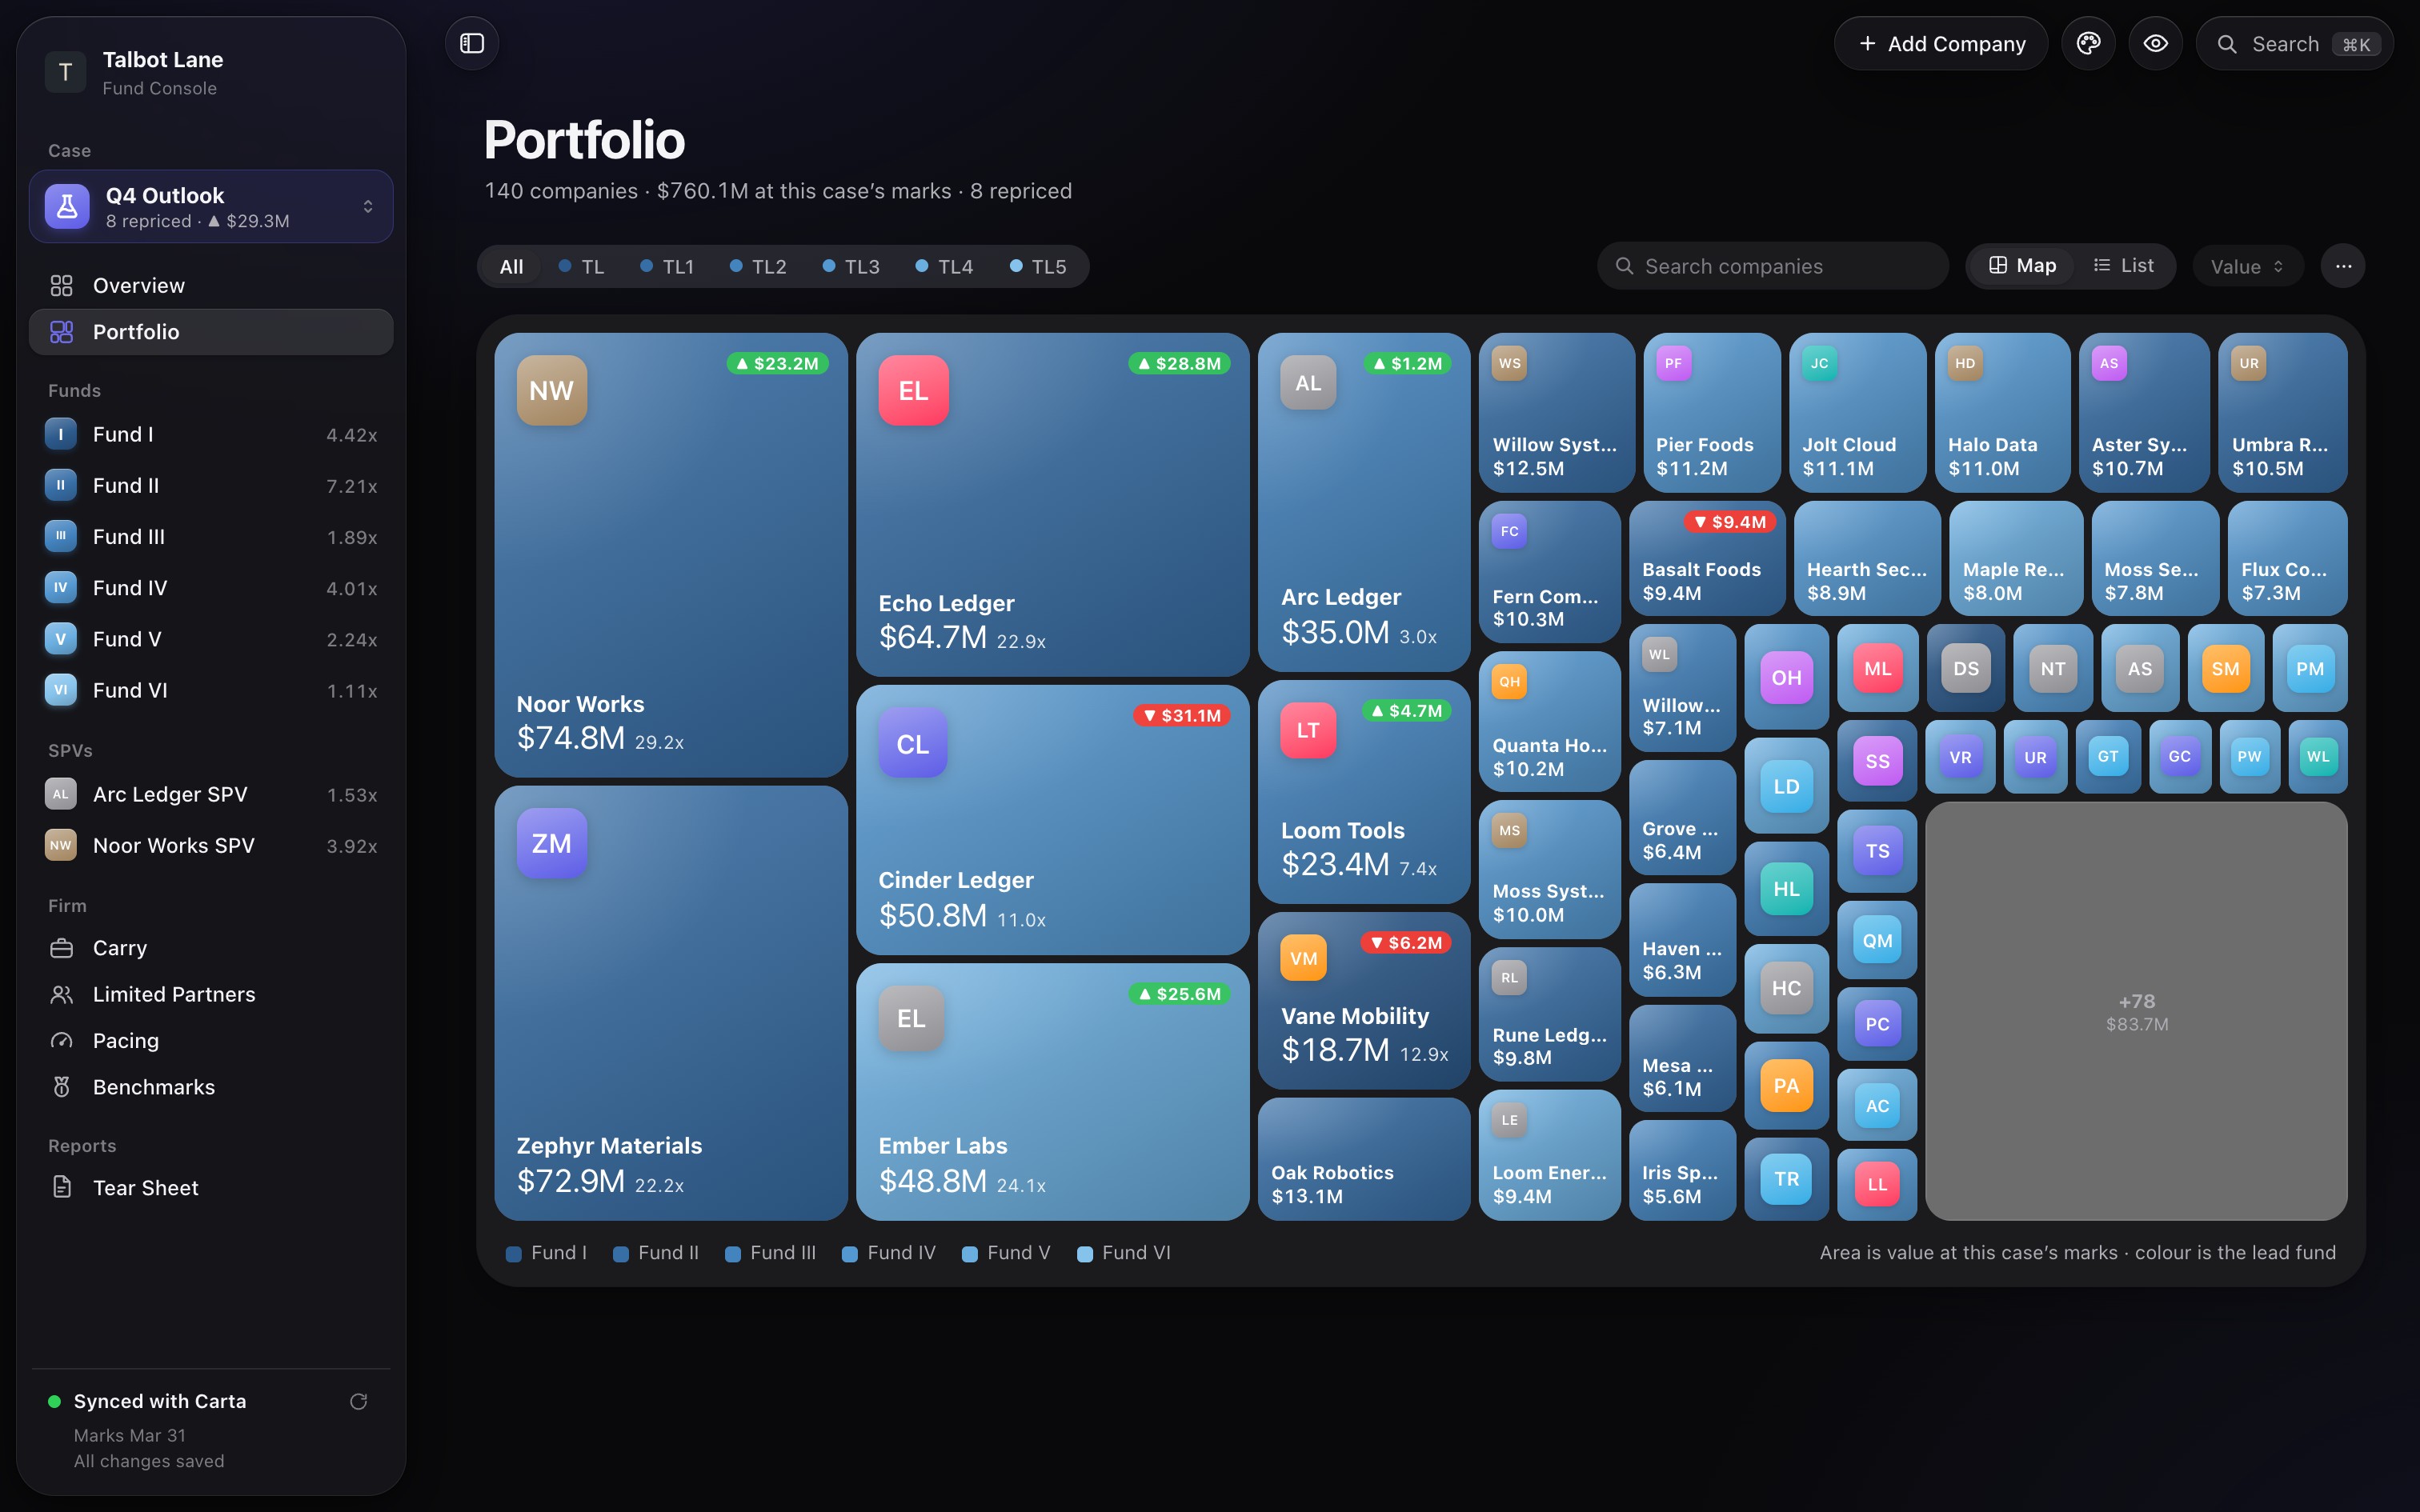
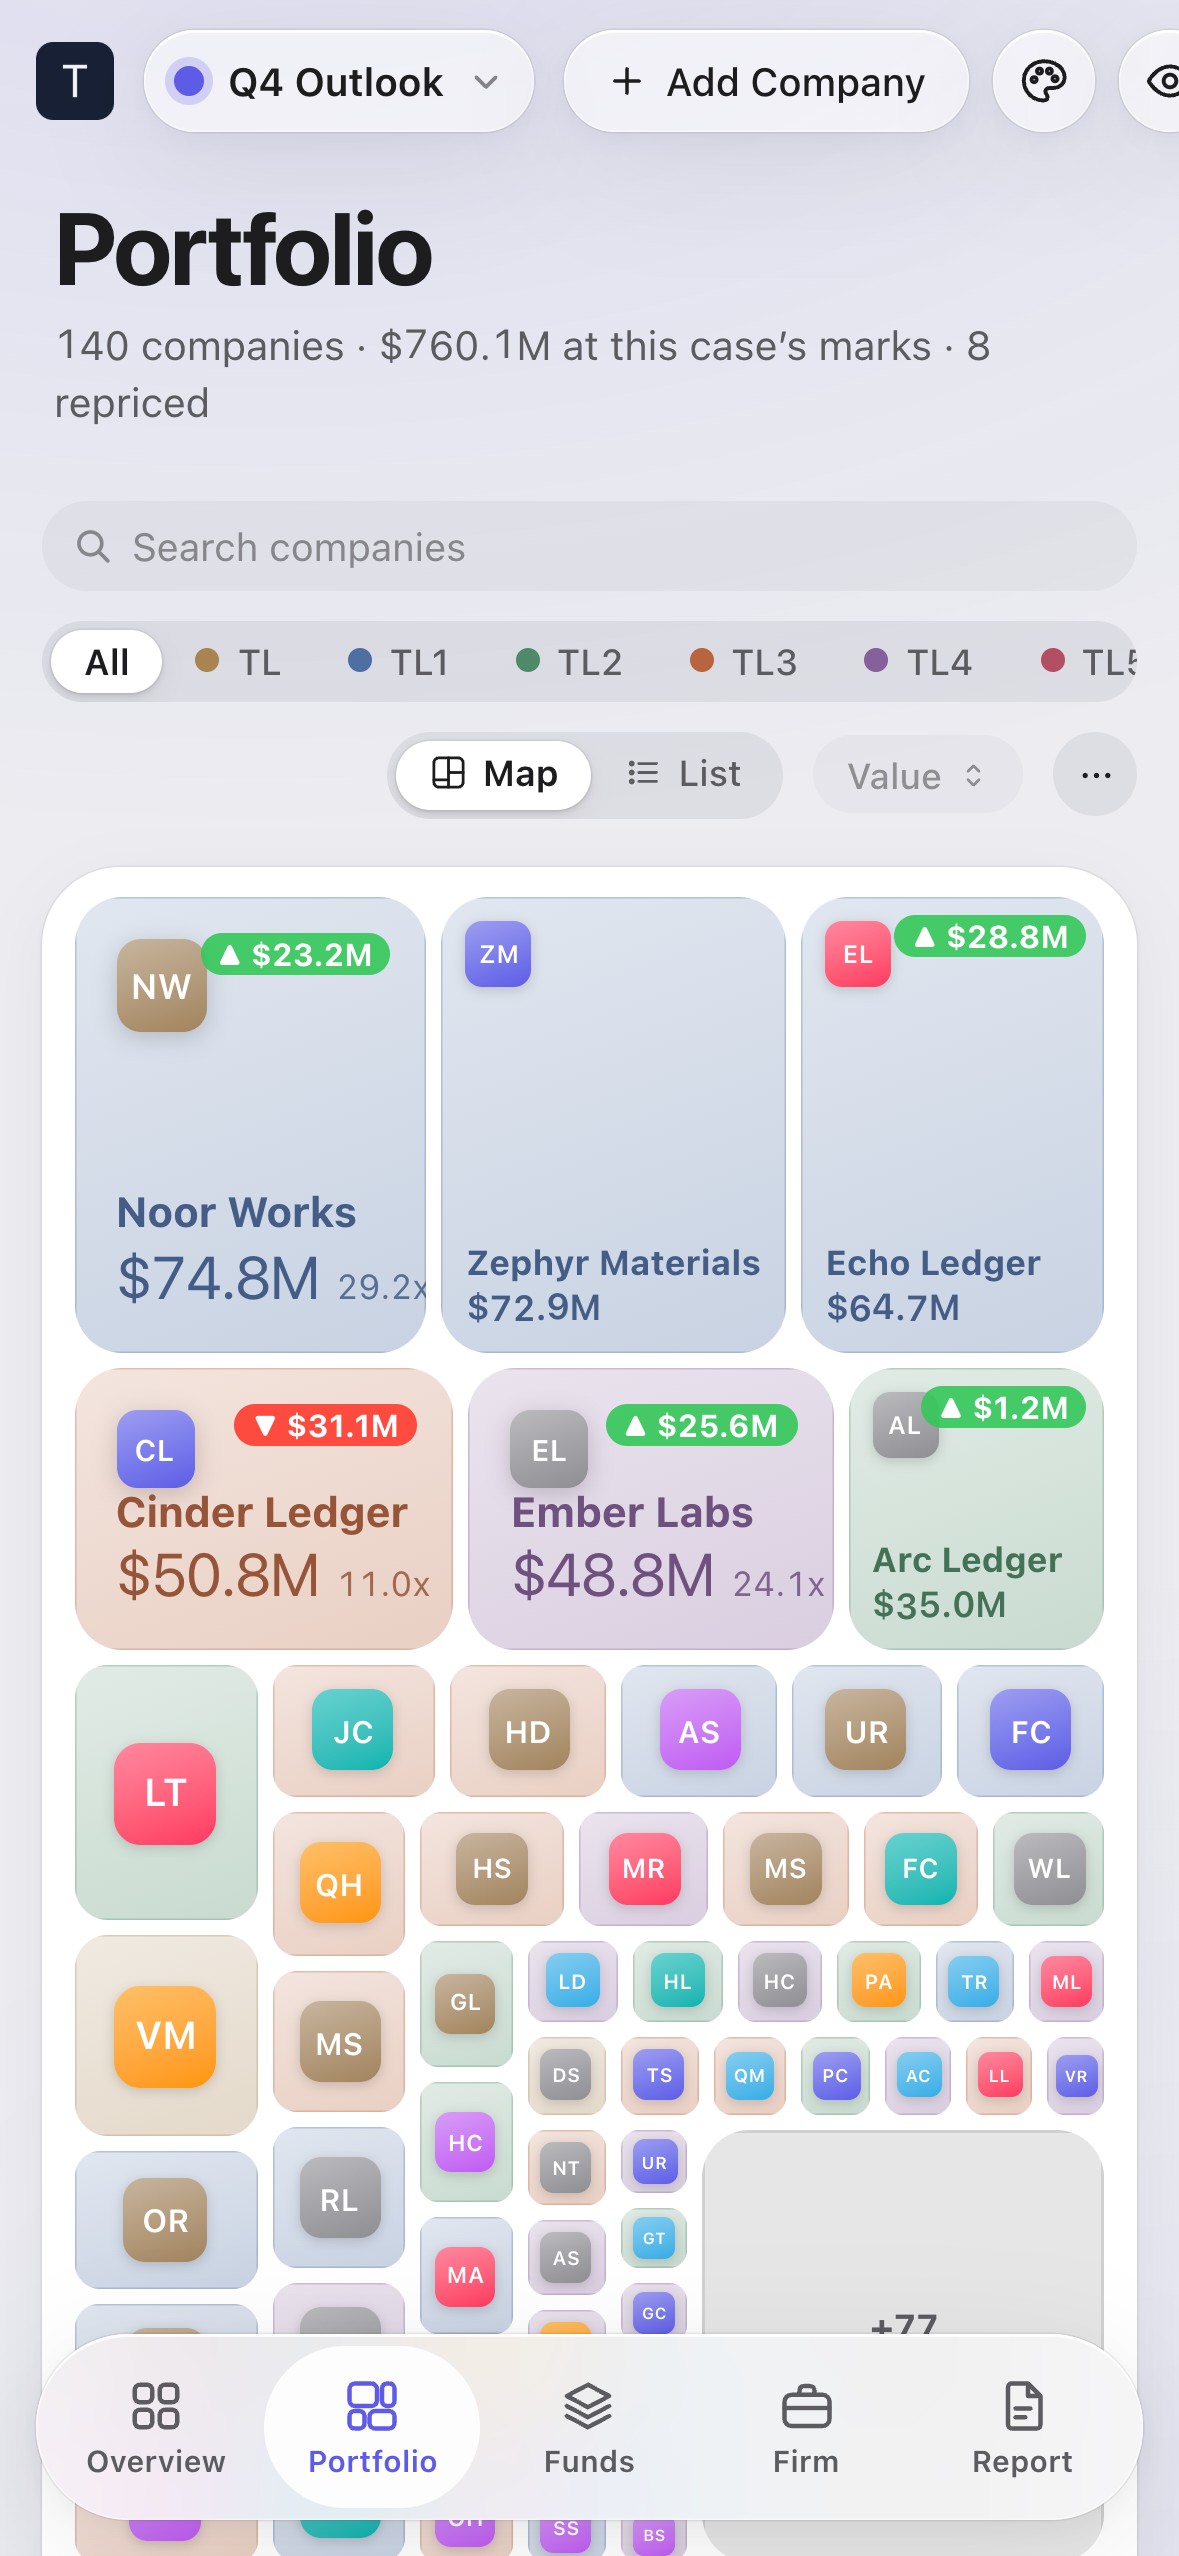
Every company in every fund sits on one map, each tile sized by what it’s worth at your marks, so what’s carrying the fund is obvious at a glance. Slide a company’s ruler and its tile grows or shrinks in real time while the rest of the book makes room. The scale is logarithmic, like the zoom dial in Camera, so $500M and $5B are equally easy to reach.
Every scenario is a case with its own hue. The whole window takes it on, so you always know which world you’re in.
Hold Option inside any case to see your admin’s own numbers. Let go and you’re back.
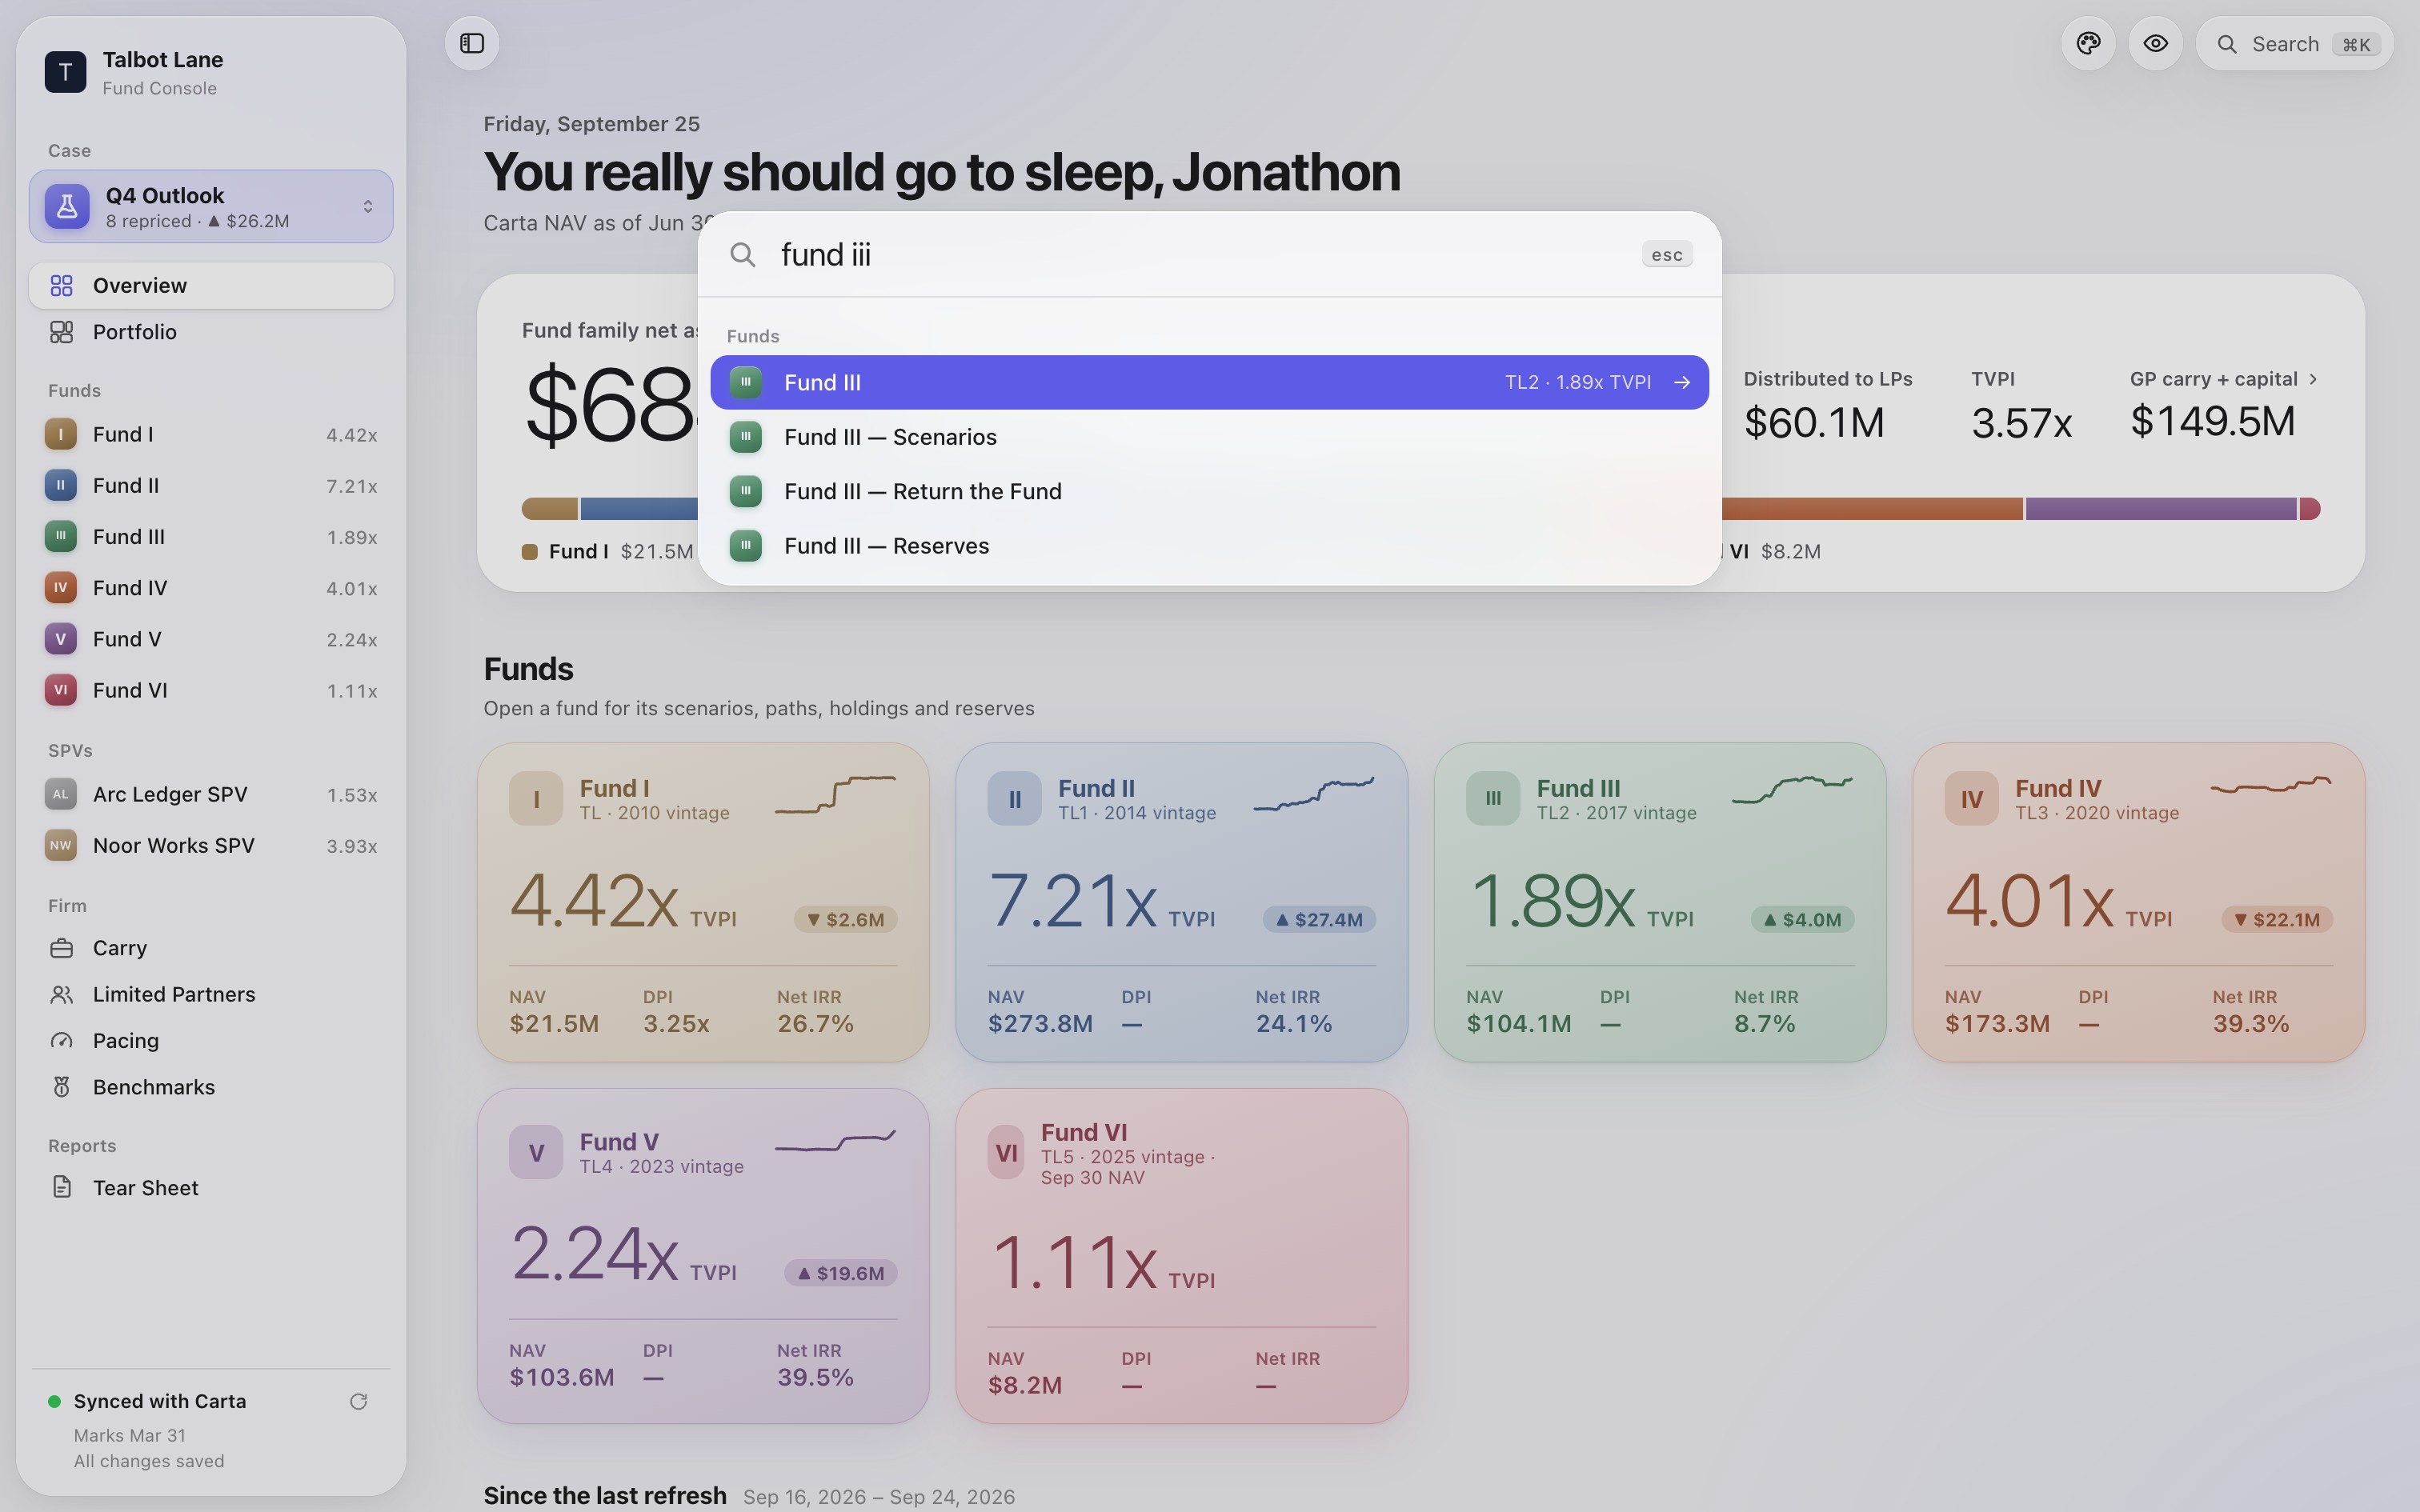
Any fund, company, case or command, from the keyboard.
Light and dark. Pick the one that looks like your firm.
Challenge assumptions and run unlimited scenarios without delay. A partner asks, an LP pushes, and the whole book reprices on screen.
The most intuitive way we’ve found to read a portfolio: every company in every fund on one map, each tile sized by what it’s worth at the marks of the case you’re in. The few carrying the fund are impossible to miss, and the long tail folds into a single tile. Switch to the list to sort by anything.

A company opens in a panel beside whatever you’re looking at, so the fund numbers stay in view while you move it. Drag the ruler or type an exact value. Or model the next round: enter the raise and the post-money to see dilution, your pro rata, and what your check buys. Lock it in and stack the next one.

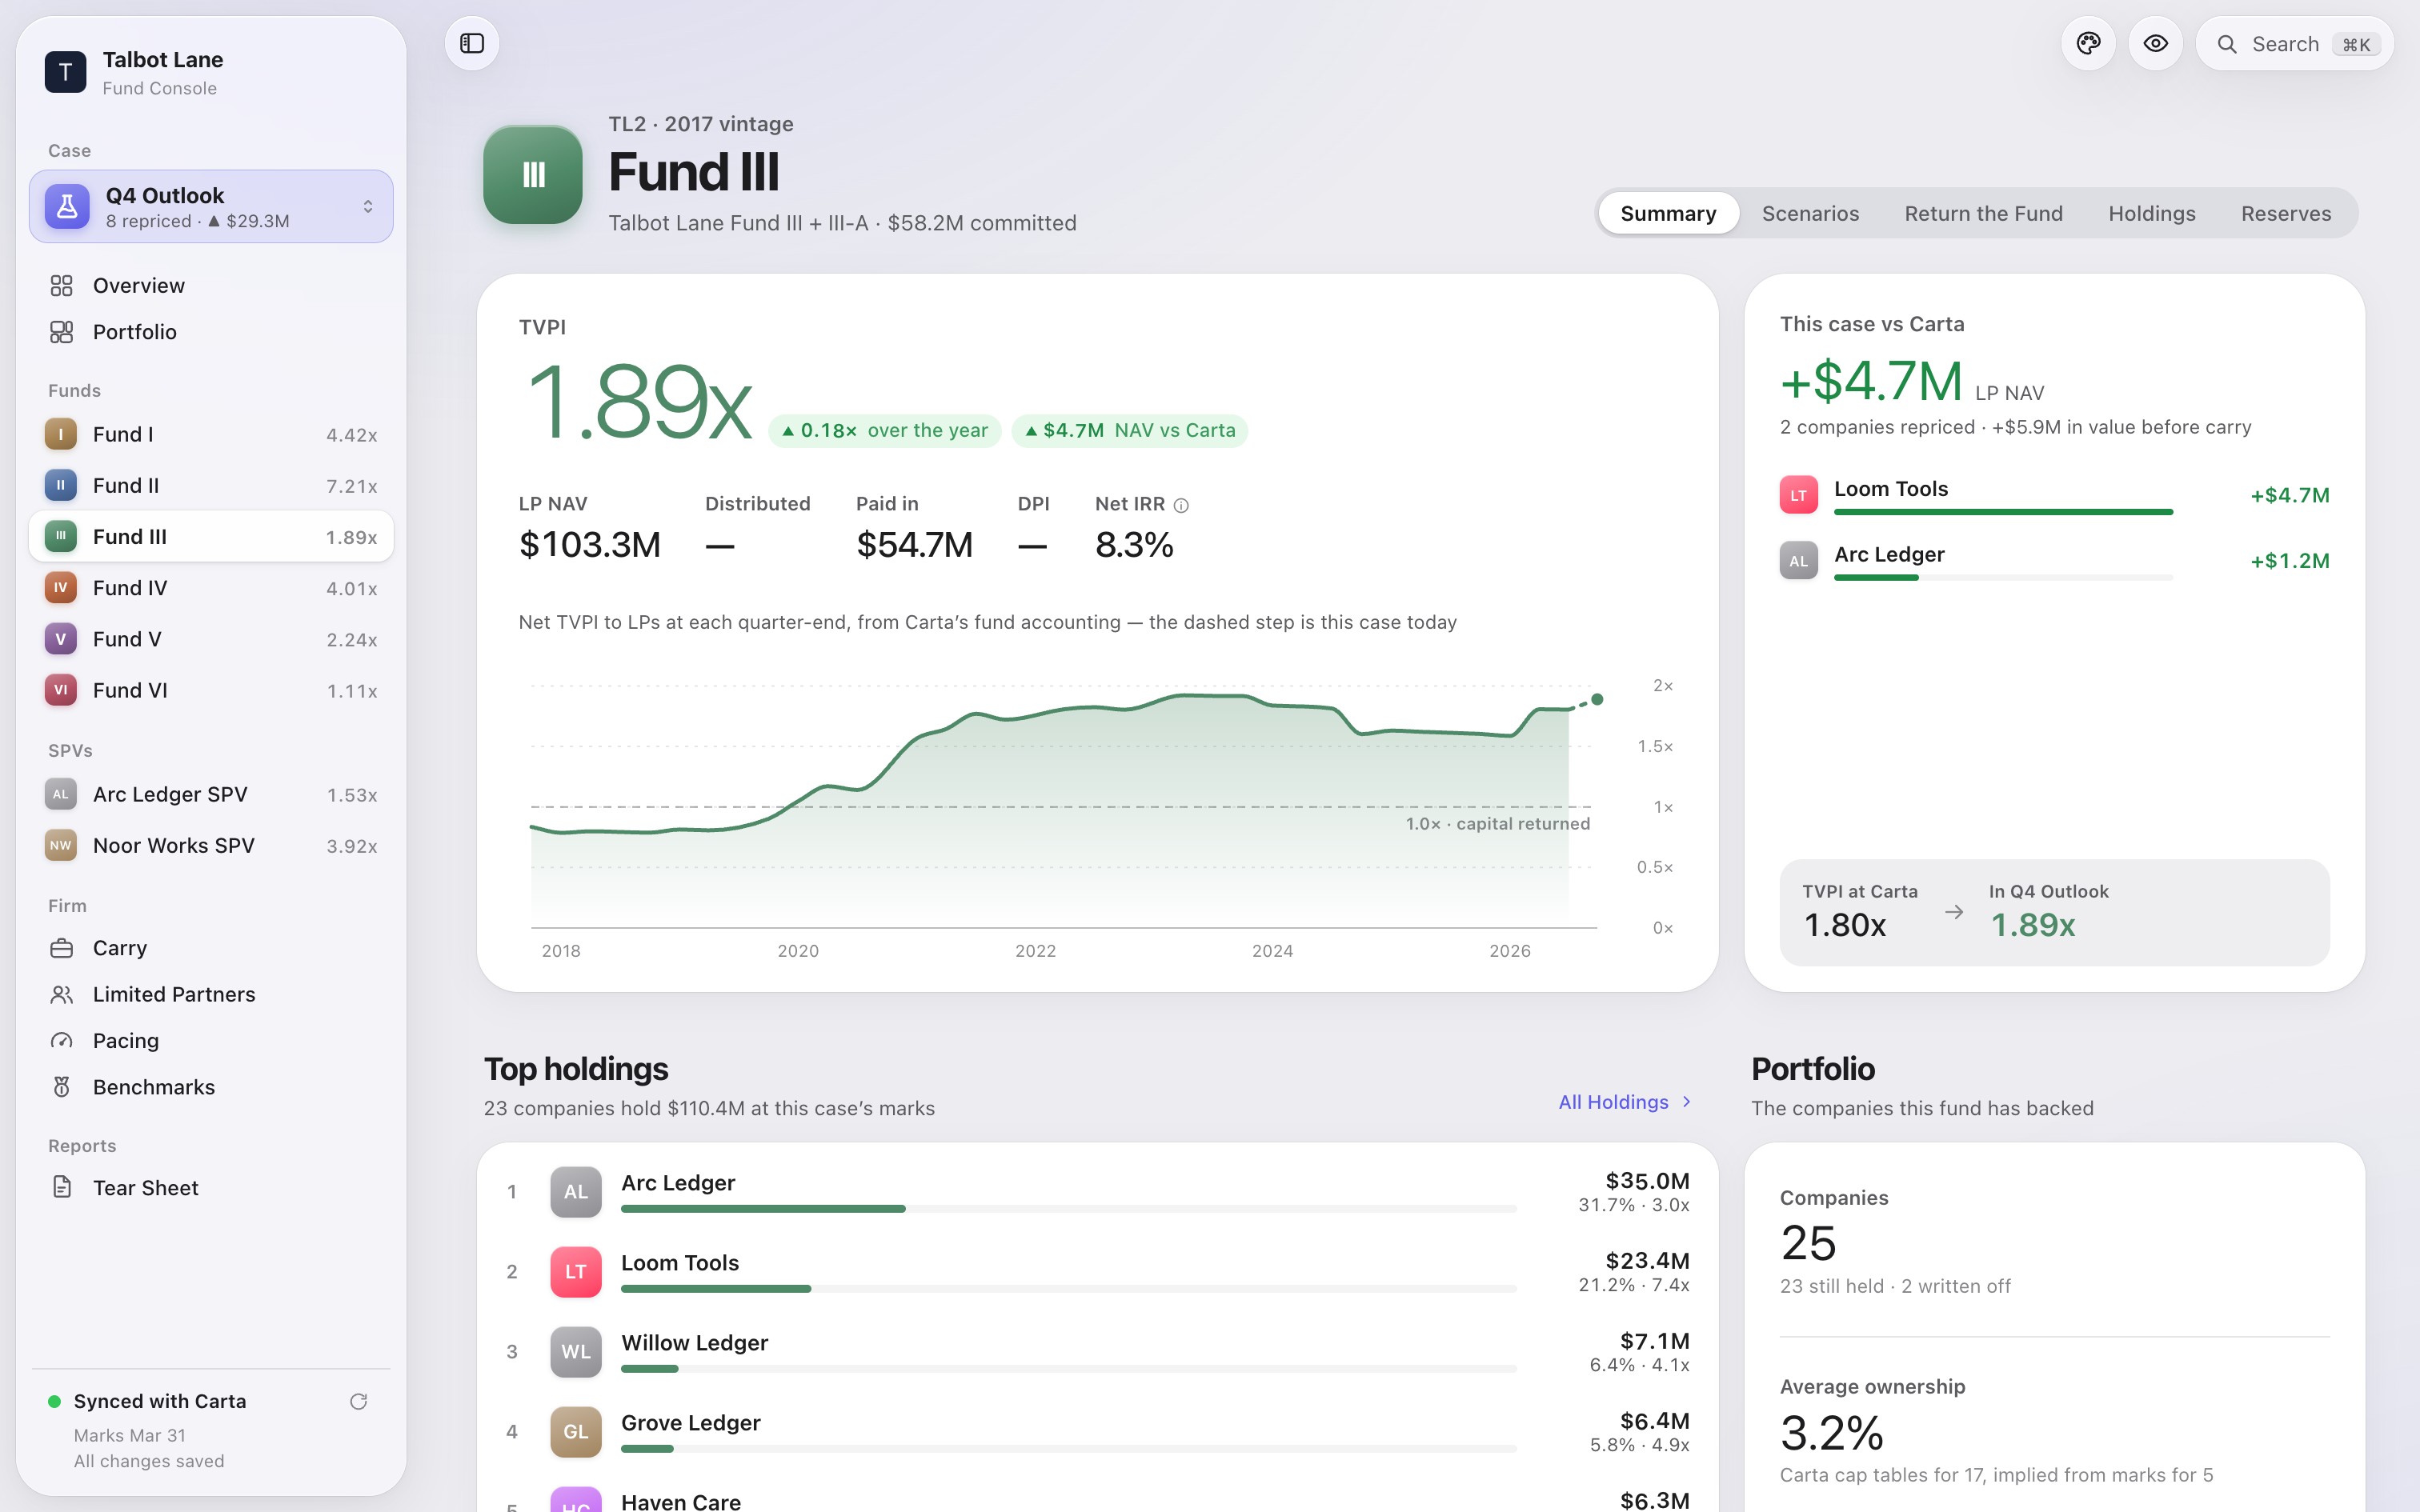
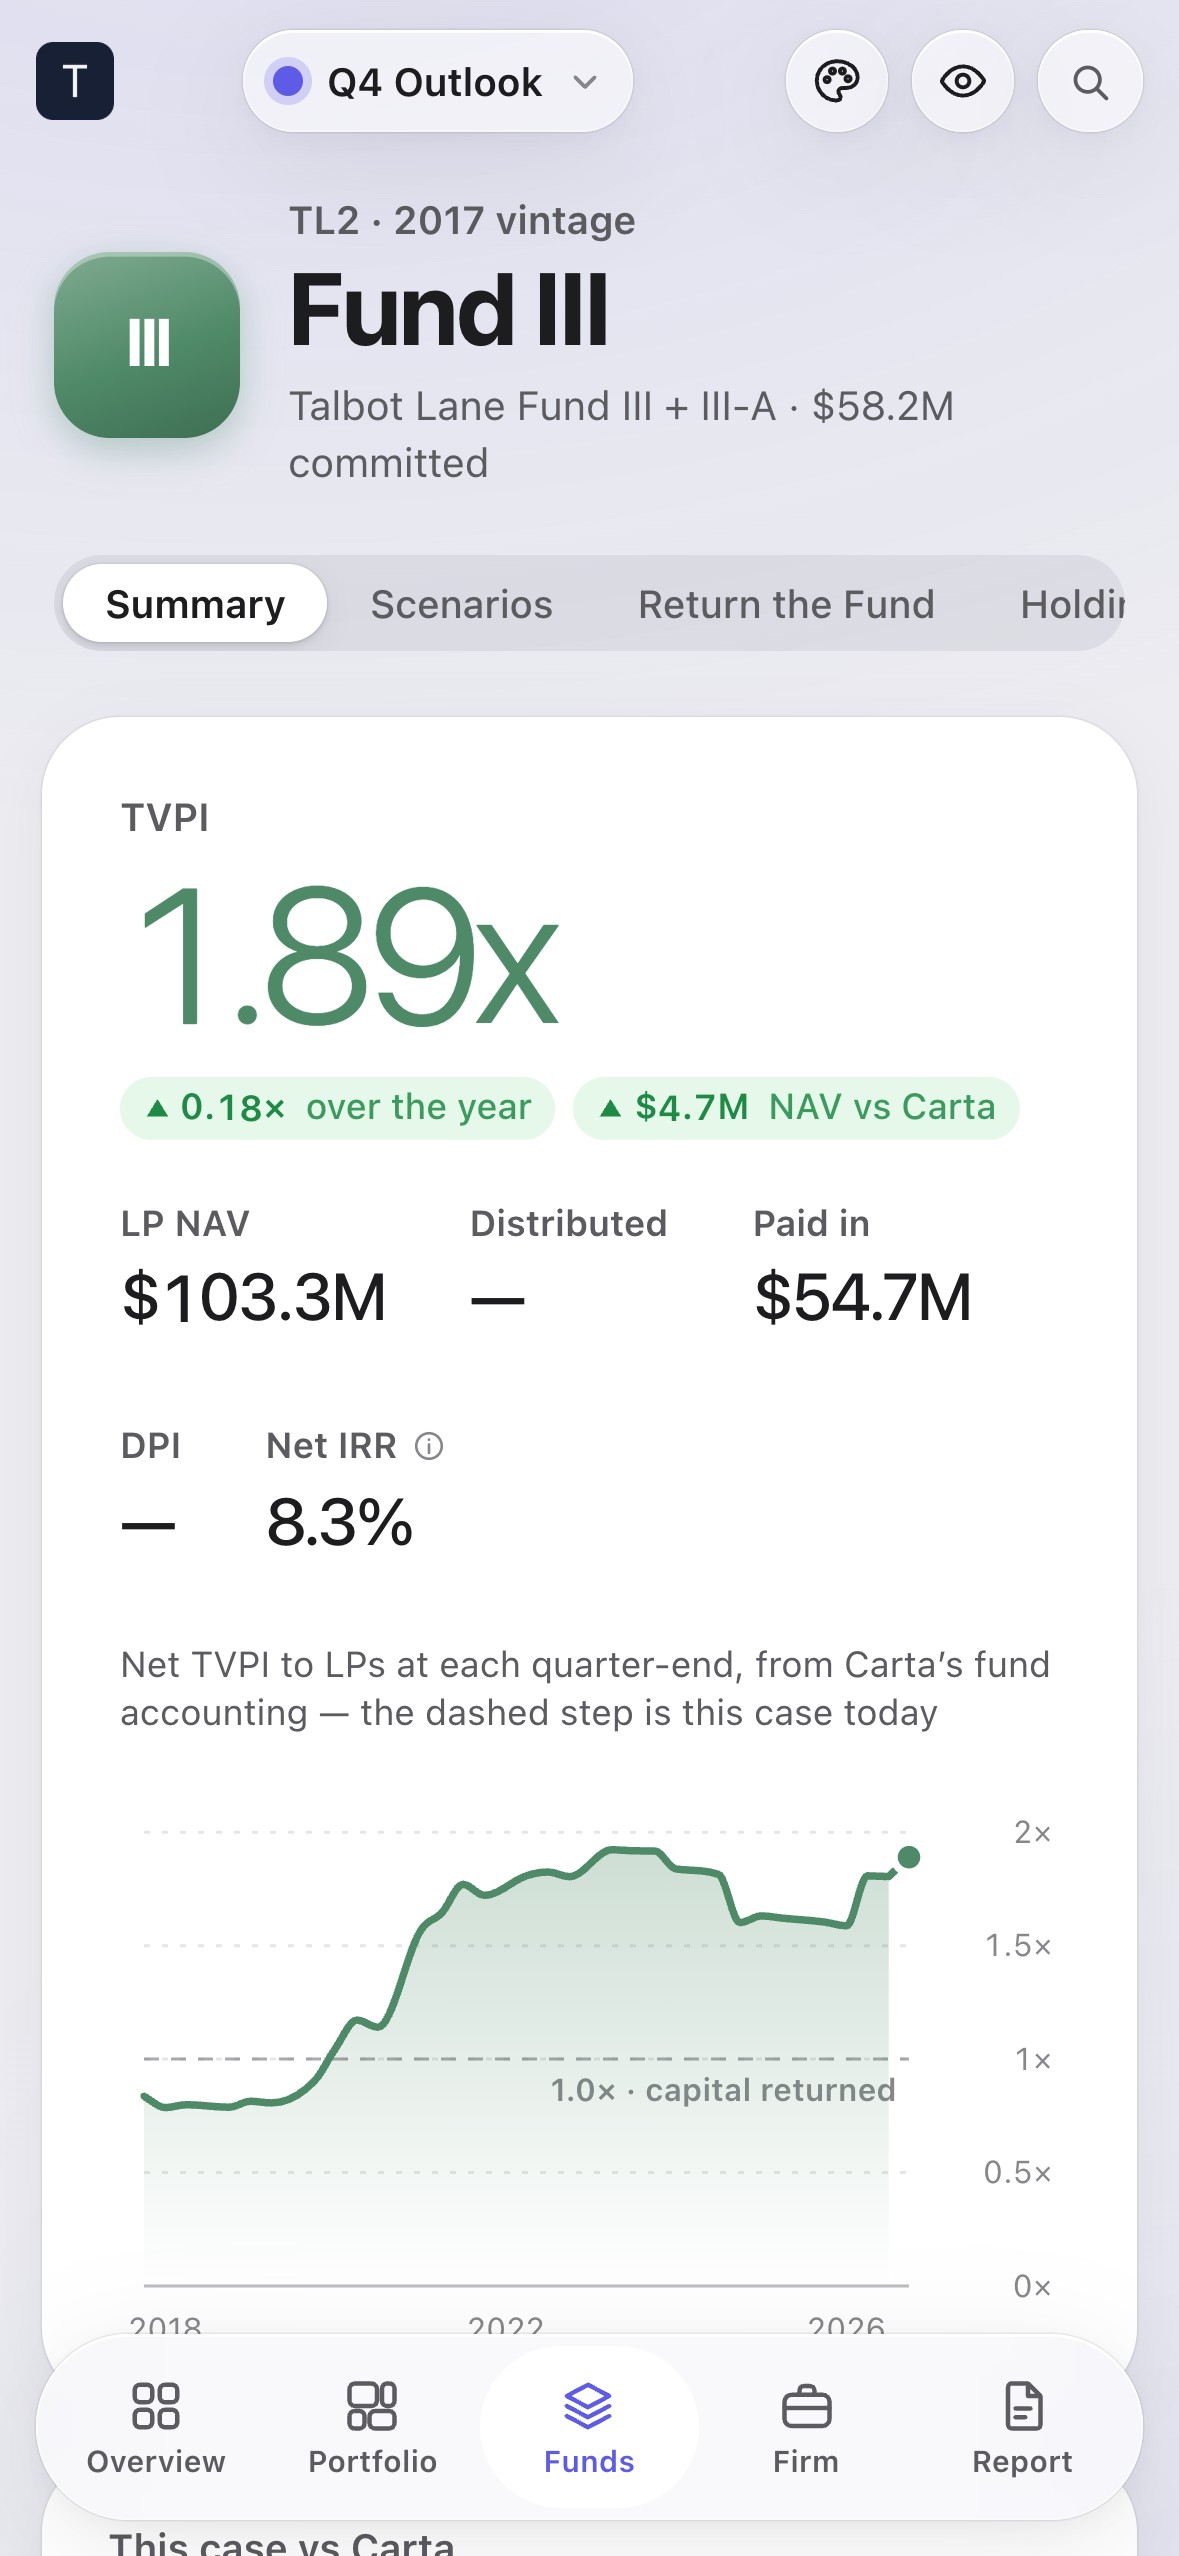
Each fund gets its own page, colour and numeral, with every question you’d ask of it one tap away.
LP NAV, TVPI, DPI and net IRR at this case’s marks, the TVPI trend quarter by quarter, and this case measured against your admin’s book.

Firm-wide views that reprice with whatever case you’re running. The sensitive ones are private by default, with a visible control for exactly who else sees them.
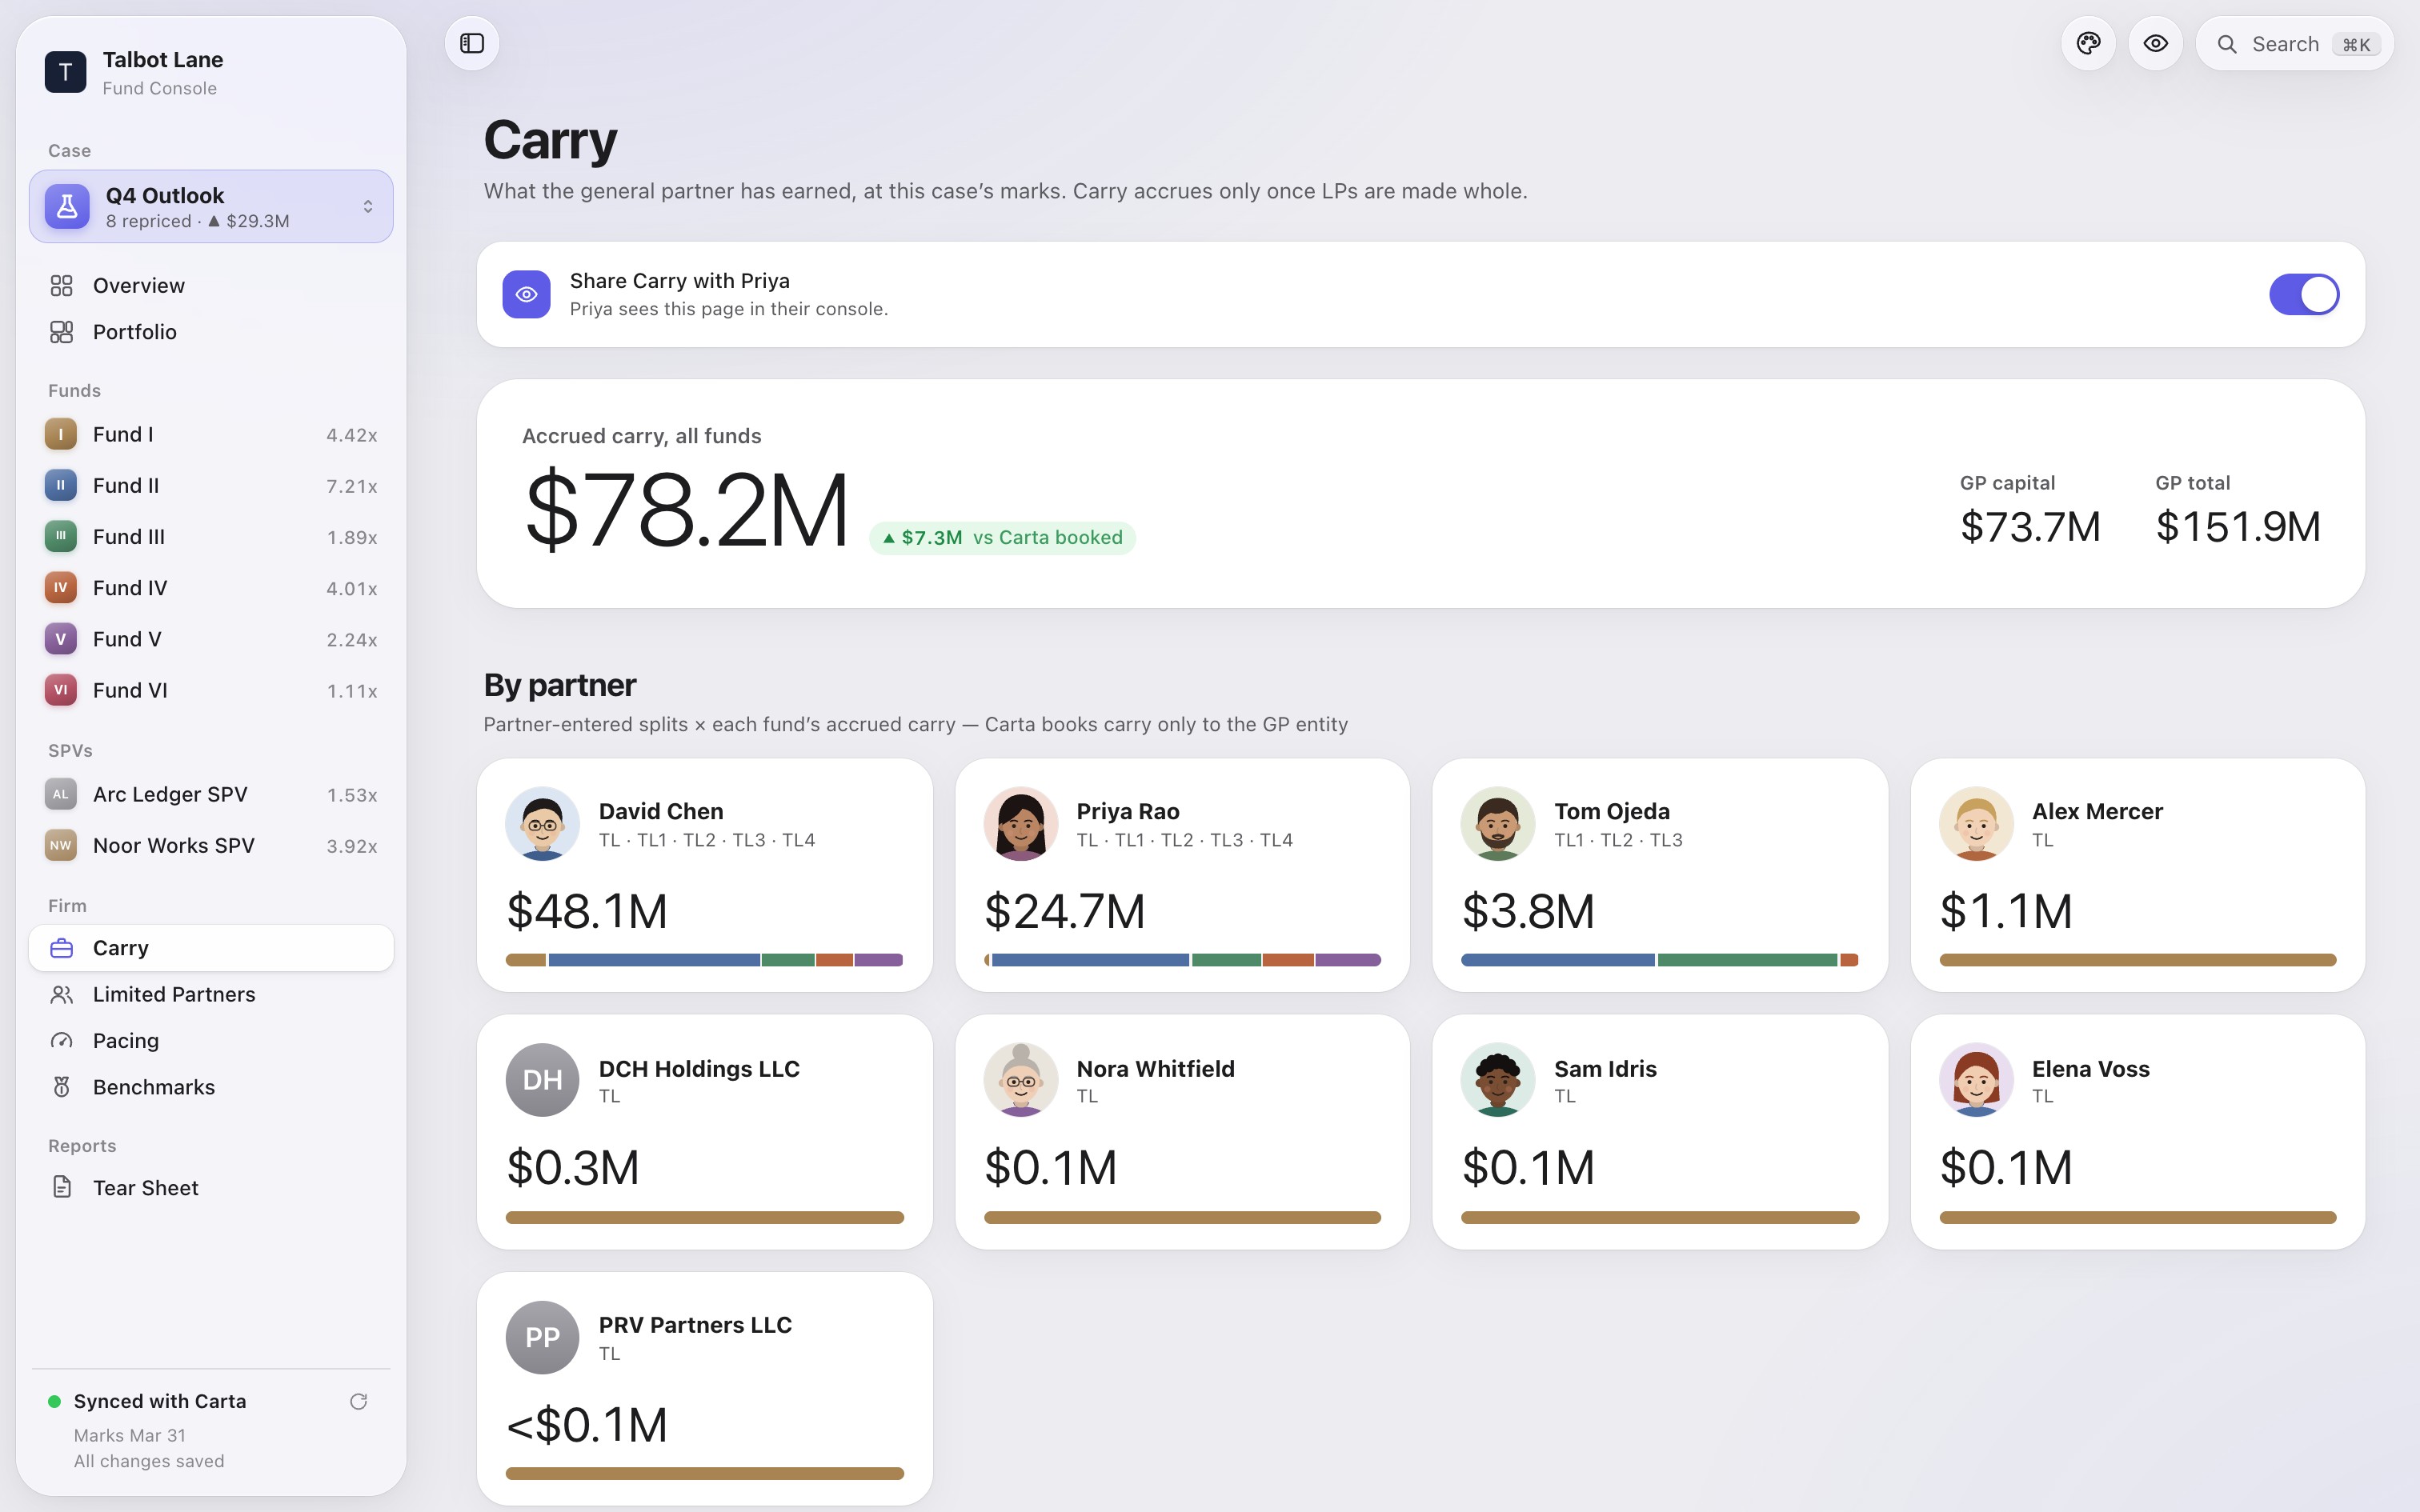
Accrued carry by fund and by partner, at today’s marks or any case. Set carry rates per fund and see what’s banked as cash.

Your admin’s marks are locked as the baseline. Every experiment is a case, a copy you can bend however you like, with its own colour. Hold ⌥ to peek back at the real book. Press ⌘K to jump anywhere.

Funds wear their colours on every card, tile and chart, so the palette you pick changes the whole console at once. Everything above is Sonoma.
Tide. One blue family by vintage, oldest deepest.

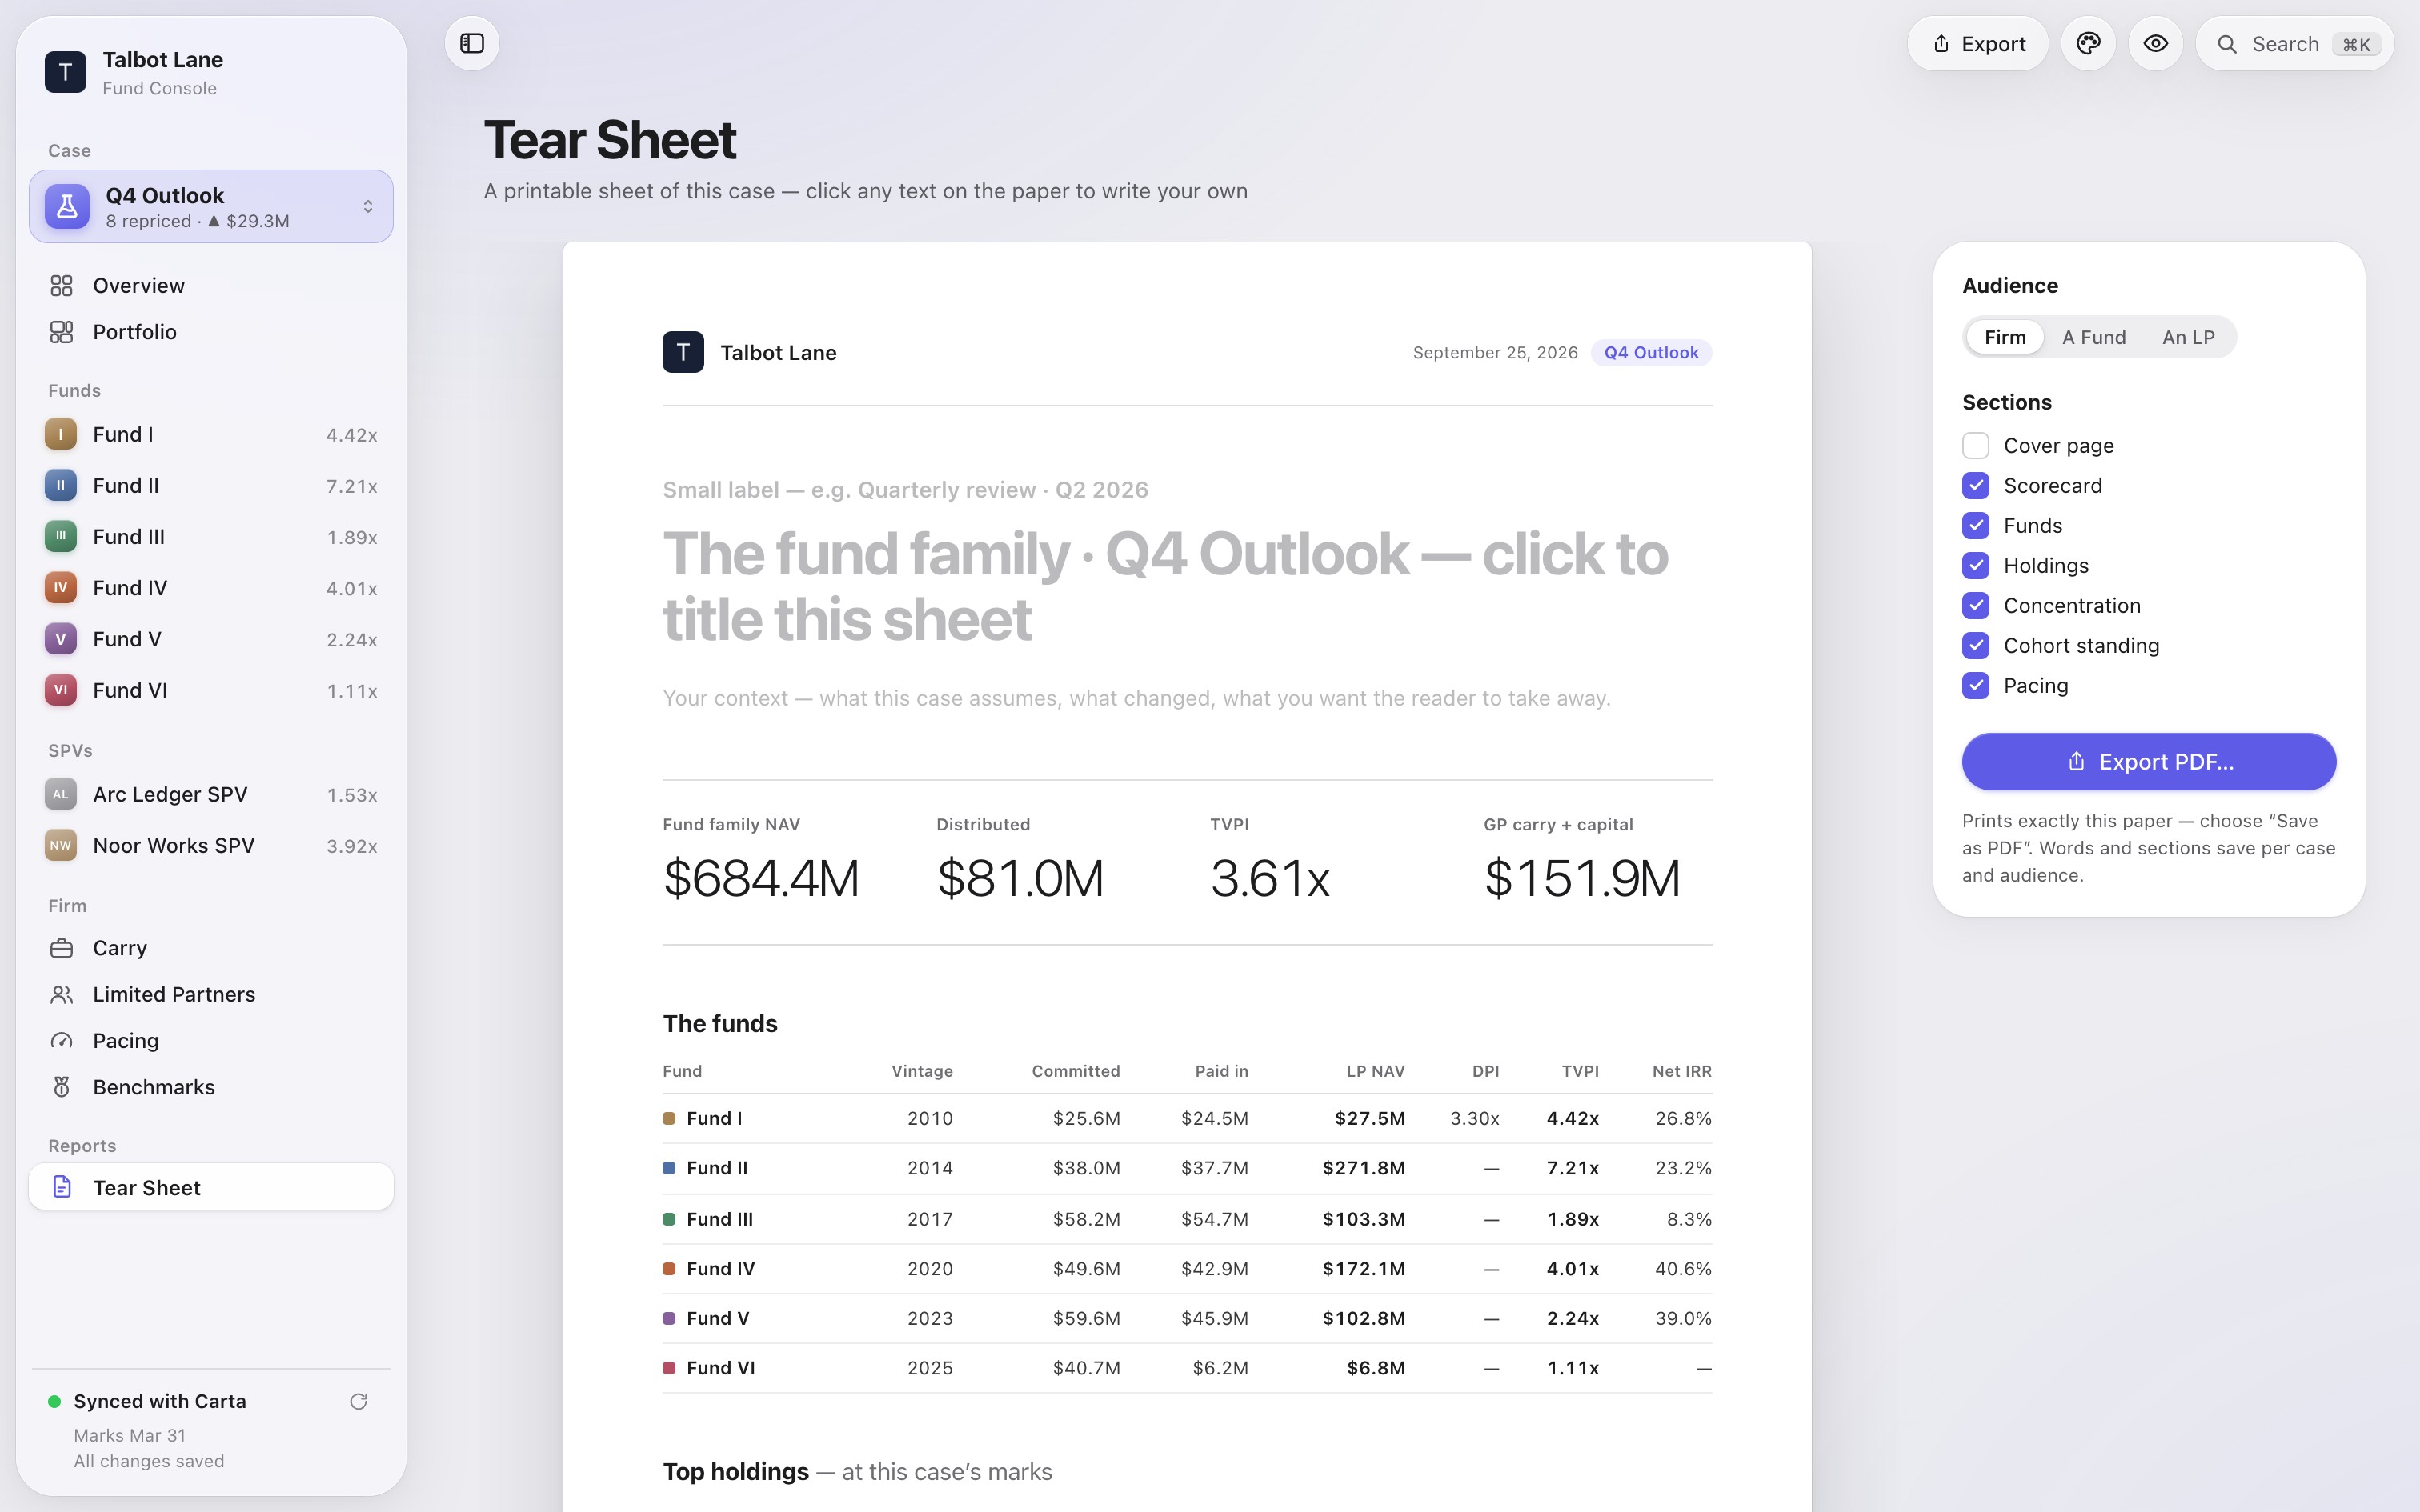
The tear sheet is now a document you compose. Scope it to the firm, one fund, or a single LP. Choose the sections, click any prose to write your own, and export exactly what you see as a PDF.

Same data, same cases, laid out for one hand behind an iOS-style glass tab bar.


Portfolio data syncs read-only from wherever your records live. Carta today, but AngelList, another admin, or the spreadsheet you already run all work. It runs on a Mac mini in the office, reachable only over Tailscale.
It runs locally in our office, and we use it in most partner and LP meetings. If you’re a GP and you want this, DM and we’ll show you how to set it up.